Join Our Telegram channel to stay up to date on breaking news coverage
ETH Price Prediction – March 12
ETH/USD moves below the key supports as the market price may continue to move down towards $1500.
ETH/USD Market
Key Levels:
Resistance levels: $2100, $2200, $2300
Support levels: $1500, $1400, $1300
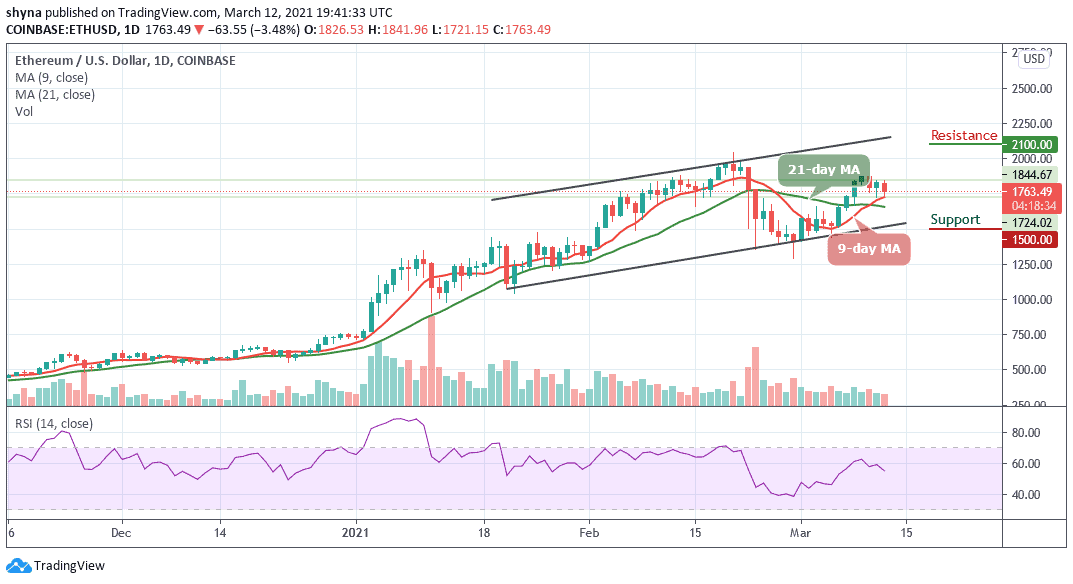
As the market opens today, after touching the high of $1841 level, ETH/USD has been dropping with a bearish bias. The coin opens at $1826 and it is currently dropping below the $1800 level. However, Ethereum price did start a nasty decline and broke many supports near $1700. The price could correct higher, but it is likely to face sellers below the 9-day moving average.
What to Expect from Ethereum (ETH)
On the downside, there is a close below the $1700 level as the coin moves towards the 9-day and 21-day moving averages. As a matter of fact, dropping below the 9-day moving average could open the doors for more losses and the price may tumble below the $1550 level. More so, should it spike below the lower boundary of the channel, the critical support levels of $1500, $1400, and $1300 may be tested as the technical indicator RSI (14) is seen moving below the 55-level.
Moreover, ETH/USD could either recover above $1850 or extend its decline. On the upside, the next major resistance is near the $1800 level. Meanwhile, the price needs to climb above the $2100, $2200, and $2300 resistance levels to move back into a positive zone. If not, there is a risk of more downsides below the channel.
When compares with Bitcoin, the daily chart shows that Ethereum’s price is trading below the 9-day and 21-day moving averages around the 3054 SAT. As soon as the price crosses above the moving averages, there is a possibility that additional benefits may be obtained in the long term. The next resistance key above this level is close to the 3500 SAT level. If the price keeps rising, it could even break the 3800 SAT and above in future sessions.
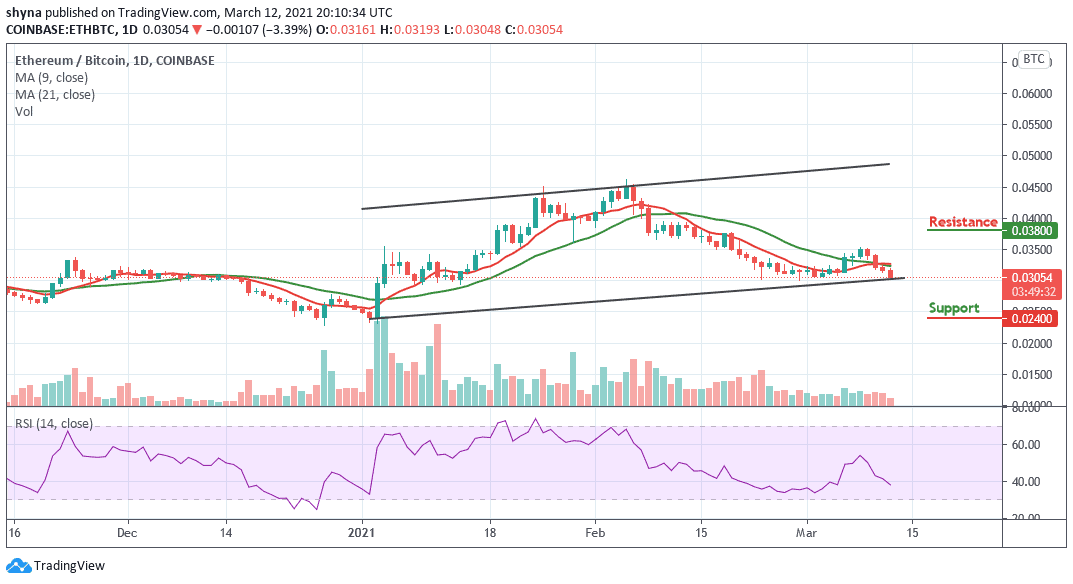
However, if the bears continue to push the price below the lower boundary of the channel, 2800 SAT and 2600 SAT supports may play out before rolling to the critical support at 2400 SAT and below. The RSI (14) is moving below the 40-level, suggesting more bearish signals.
Join Our Telegram channel to stay up to date on breaking news coverage