Join Our Telegram channel to stay up to date on breaking news coverage
BCH Price Prediction – March 12
The Bitcoin Cash’s sudden dip below $550 today as the coin may likely reclaim back the losses if the bulls step back.
BCH/USD Market
Key Levels:
Resistance levels: $650, $700, $750
Support levels: $450, $400, $350
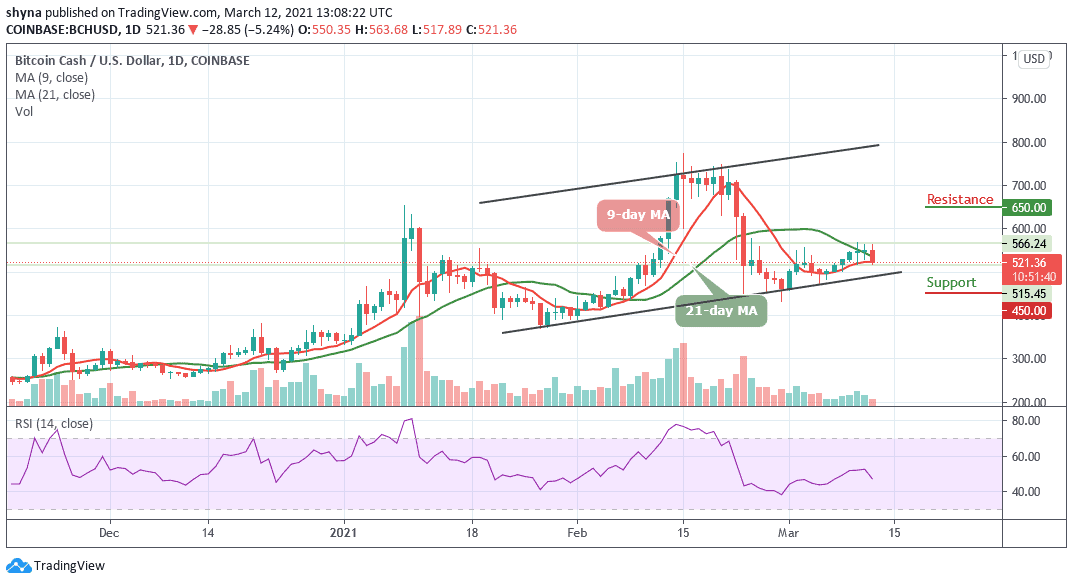
BCH/USD is currently experiencing a downtrend as the bears dominate the entire crypto landscape. At the time of writing, BCH/USD is hovering within the 9-day and 21-day moving averages as the trend has a bearish inclination, which may likely retest the support at $500. More so, the technical indicator has remained bearish as the RSI (14) continues to dig deeper below the 50-level.
Where is BCH Price Going Next?
As the daily chart reveals, the best bulls can do is to defend the support at $500 and focus on pulling towards $550. A few days ago, the coin has been following sideways movement but the sharp drop today affected the buyers from an attempted recovery above $563. However, BCH/USD is making an effort to push the price back above the moving average and it is also looking forward to reclaiming the ground past $600.
Meanwhile, if there is an increase in buying pressure, the price may break above the moving averages to reach the $600 resistance. While trading at that level, a bullish continuation could reach the resistance levels of $650, $700, and $750 respectively.
In other words, if the coin decides to remain on the negative side, a minimum swing may likely bring the price to a $500 level. Exceeding this level could take the bears to $450, $400, and $350 levels by crossing below the lower boundary of the channel.
When compares with Bitcoin, bears keep pushing the price towards the south. According to the recent negative sign, the trend may continue to follow the downtrend in as much as the buyers failed to push the price above the 9-day and 21-day moving averages.
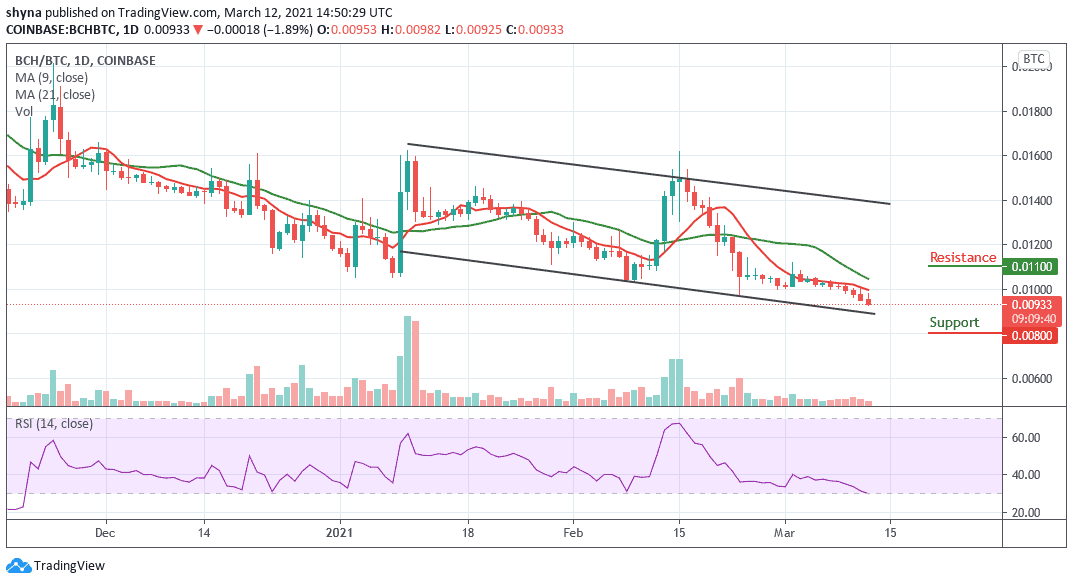
However, as the technical indicator RSI (14) slides below the 30-level, it may likely cross into the oversold region and a bearish continuation could lower the price to the support levels of 0.008 BTC and below, but once it moves out of this zone, the market price may likely begin an upward trend to push the coin towards the resistance level of 0.011 BTC and above.
Join Our Telegram channel to stay up to date on breaking news coverage