Join Our Telegram channel to stay up to date on breaking news coverage
LTC Price Prediction – March 2
The Litecoin price is currently changing hands at $183.19 as the technical indicator RSI (14) moves around 45-level.
LTC/USD Market
Key Levels:
Resistance levels: $220, $230, $240
Support levels: $130, $120, $110
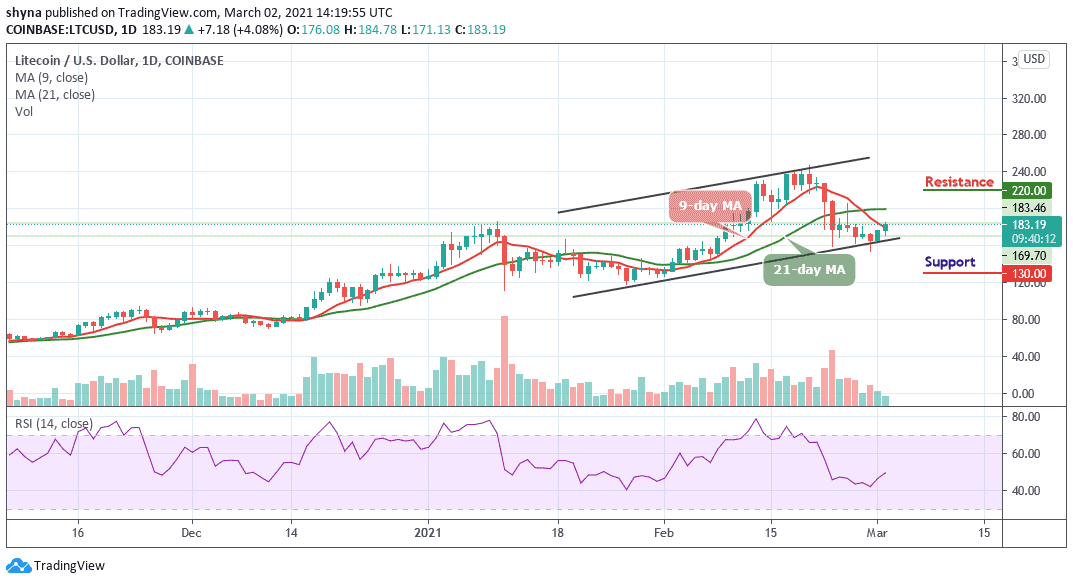
LTC/USD is currently trading at around $183 and once it manages to surpass the potential resistance of $200, the next target is located at $205 where it touched a few days ago. However, a breach from here may send the price straight to around $170 as the last 48-hours surge is supported at the $150 support level. Therefore, if this level fails to hold strong, the price could slip back below the lower boundary of the channel.
What to Expect from Litecoin
However, looking at the current market sentiment, the bulls are now gaining back control of the market. Moreover, if the bulls can put more effort and push the market price above the moving averages, then LTC/USD may likely hit the resistance levels of $220, $230, and $240 respectively. Meanwhile, any movement above these key resistance levels may likely encourage further buying.
Nevertheless, a break below the lower boundary of the channel may provoke an even deeper decline towards the critical supports at $130, $120, and $110. Meanwhile, looking at the technical indicator RSI (14), Litecoin may exhibit the tendencies to follow an upward trend as the coin moves towards the 50-level which may cause the market to remain stable at the average.
Against Bitcoin, the LTC price is making an attempt to cross the 9-day moving average in other to reach the resistance at 3800 SAT. Unless this resistance is effectively exceeded and the price ends up closing above it, there might not be any reason to expect the long-term bullish reversal.
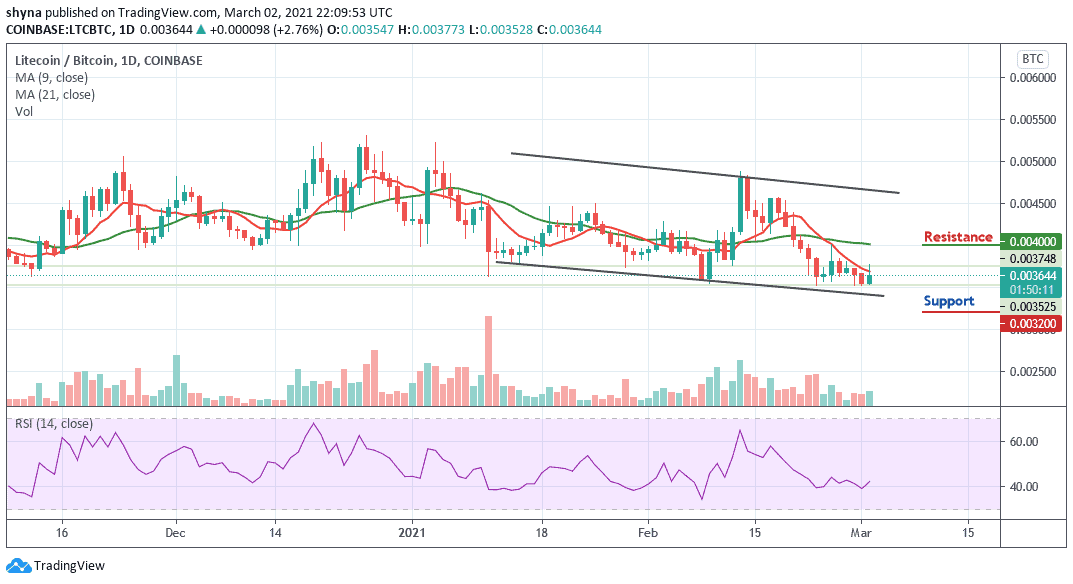
However, trading below the lower boundary of the channel could refresh lows under 3300 SAT and a possible bearish continuation may likely meet the major support at 3200 SAT and below while the buyers may push the coin to the potential resistance at 4000 SAT and above. More so, the RSI (14) moves above 40-level, suggesting more bullish signals.
Read more:
- Ethereum Classic Open Interest Peaks, Price Set to Surge
- Bitcoin Cash Price Prediction: BCH/USD Regains Ground, Bulls Target $240
Join Our Telegram channel to stay up to date on breaking news coverage