
Join Our Telegram channel to stay up to date on breaking news coverage
Fantom (FTM) Price Prediction – August 10
The Fantom market is currently showcasing lower highs, trading against the valuation of the US fiat currency. In the fifty-two weeks of trading, the crypto’s low value is at $0.1961, and its high-value line is at $3.48, running for about nine months. As of the time of writing, the price trades around $0.38 at an average of 1.50% positive.
Fantom (FTM) Price Statistics:
FTM price now – $0.3801
FTM market cap – $1.1 billion
FTM circulating supply – 2.6 billion
FTM total supply – 2.6 billion
Coinmarketcap ranking – #53
FTM/USD Market
Key Levels:
Resistance levels: $0.50, $0.60, $0.70
Support levels: $0.30, $0.25, $0.20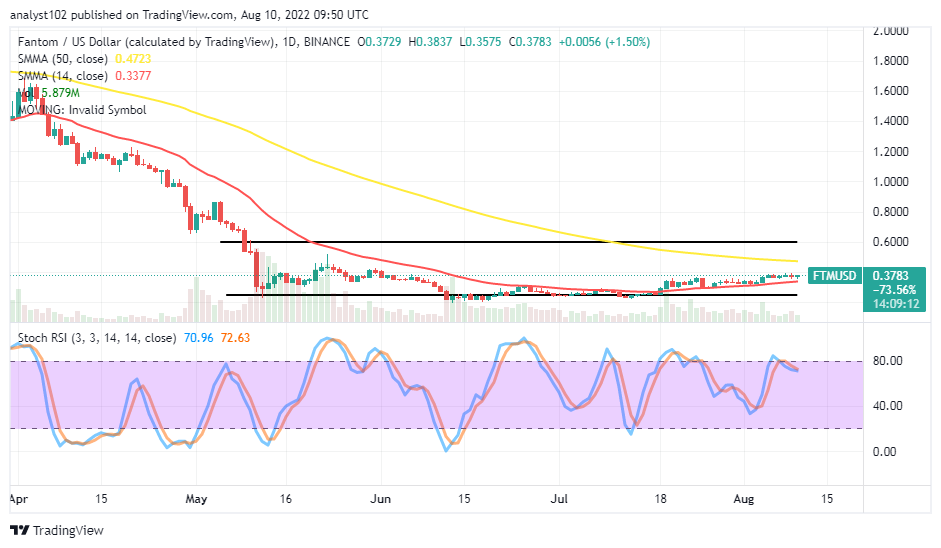 FTM/USD – Daily Chart
The FTM/USD daily chart reveals the crypto economy is showcasing lower highs that have predominantly occupied space over the trend line of the smaller SMA at a close point. The 50-day SMA indicator’s value line is at the $0.4723 resistance level above the $0.3377 of the 14-day SMA indicator. The Stochastic Oscillators have swerved northbound from the range of 40 to get crossed at the 80 range, stretching eastbound to denote that the market is in a range-moving manner.
Will the FTM/USD market go more ranging, below the $0.4723 resistance point of the 50-day SMA?
There can be more range-moving modes in the FTM/USD market activity as it has been that the crypto trade is showcasing lower highs below the trend line of the 50-day SMA indicator. At the moment, it would be that investors should consider it ideal to invest or increase the portfolio size in this crypto business operation. Long-position takers are to exercise patience by not overburdening the market with a high-lot size or too many buying orders that their account position might not carry in the long run.
On the downside of the technical analysis, the FTM/USD market bears need to watch for an active lapse that can re-occur when the price tends to swing upward falsely toward a resistance point around the 50-day SMA at the $0.4723 before considering a selling order. Short-position placers are to look out for the exhaustion of a price movement at a higher-resistance trading spot to observe a relaunch of a stance afterward.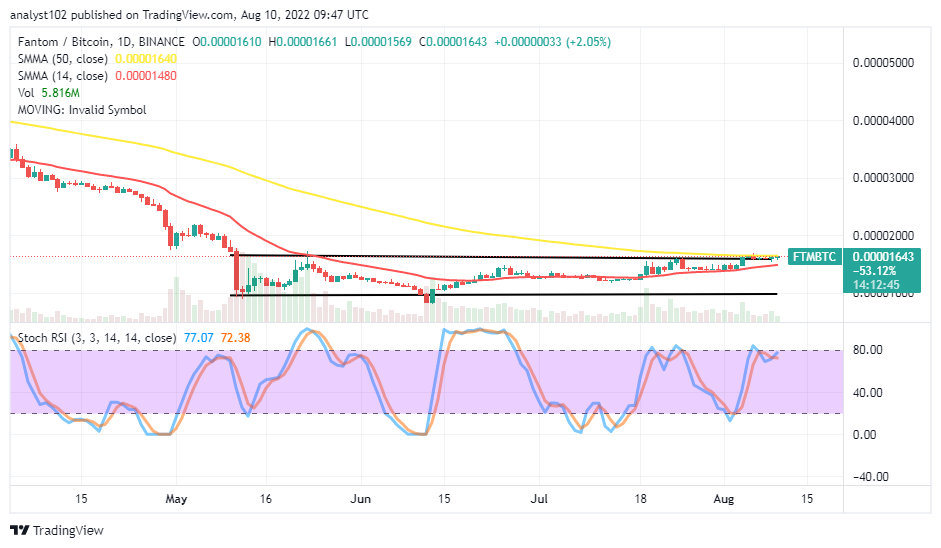
FTM/BTC Price Analysis
Fantom’s market trending weight against Bitcoin has remained at a higher-trading spot. The cryptocurrency pair price is showcasing lower highs tightly below the trend line of the bigger SMA. The 14-day SMA indicator is at B0.00001480 underneath the 50-day SMA indicator’s value line at B0.00001640. The Stochastic Oscillators are around the 80 range, seemingly trying to cross northbound to denote the base crypto is still somewhat prevalent in the market at the expense of the counter-trading crypto’s weakness to make a comeback.
Read more:
Join Our Telegram channel to stay up to date on breaking news coverage