Join Our Telegram channel to stay up to date on breaking news coverage
Fantom (FTM) Price Prediction – May 24
Fantom (FTM) market has been trending to bearish as it trades against the valuation of the US Dollar over several couples of sessions. Its all-time high stands at $3.48 since seven months ago, and the all-time low is at $0.001953, running two years ago. Presently, the market is trading around $0.42 at an average rate of 3.18% negative.
Fantom (FTM) Price Statistics:
FTM price now – $0.4161
FTM market cap – $1.1 billion
FTM circulating supply – 2.6 billion
FTM total supply – 2.6 billion
Coinmarketcap ranking – #52
FTM/USD Market
Key Levels:
Resistance levels: $0.50, $0.70, $0.90
Support levels: $0.20, $0.15, $0.10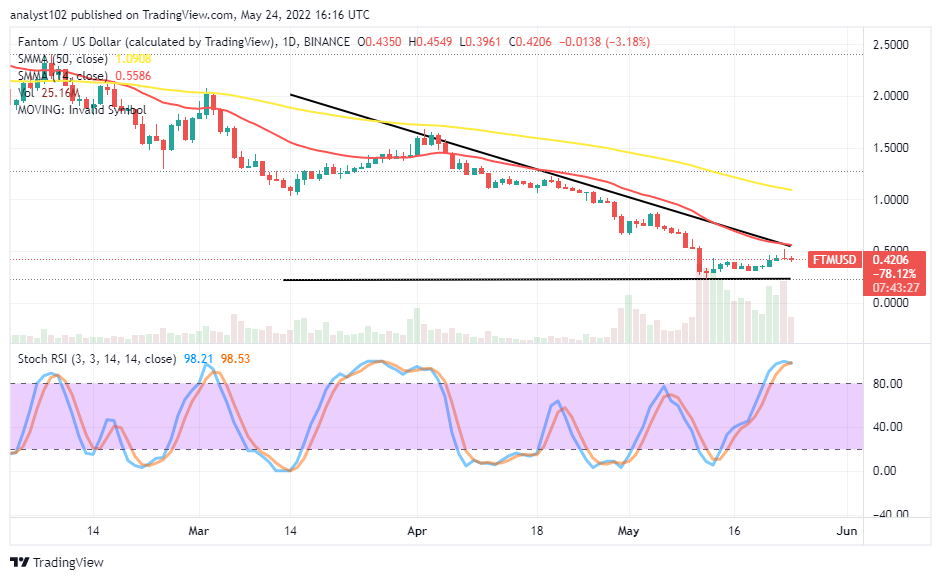 FTM/USD – Daily Chart
The daily chart reveals the FTM/USD market operation has been trending bearish on a slow-moving pace characterized by smaller-bearish candlesticks under the sell signal side of the smaller SMA. The 50-day SMA indicator is above the 14-day SMA indicator. The Stochastic Oscillators are in the overbought region, and lines are freshly closed within to indicate the possibility of the price not having the strength to push northward further away from its present trading spot.
Will the FTM/USD market succumbs to a declining force around the $0.50 resistance level?
As the FTM has been trending bearish against the purchasing worth of the US Dollar, it has been the abiding routine practice by the FTM/USD market to succumb to a decline around the 14-day SMA trend line over time. It expected the price to abide by a downward force to prevail around the $0.50 resistance level soon afterward. Nevertheless, the downward motion is to extend down to find support within those lower points set above in the long-term run. In the meantime, investors may start considering buying into this crypto economy from this point before the resumption of a bullish trend.
On the downside of the technical analysis, the FTM/USD market price seems to encounter an overhead barrier trading line around the $0.50 resistance level. Short-position takers have to exercise some degree of patience to observe what could the subsequent price actions around the 14-day SMA indicator before taking to a sell order. A range-bound trading pattern may play out below the resistance value level earlier indicated for a while.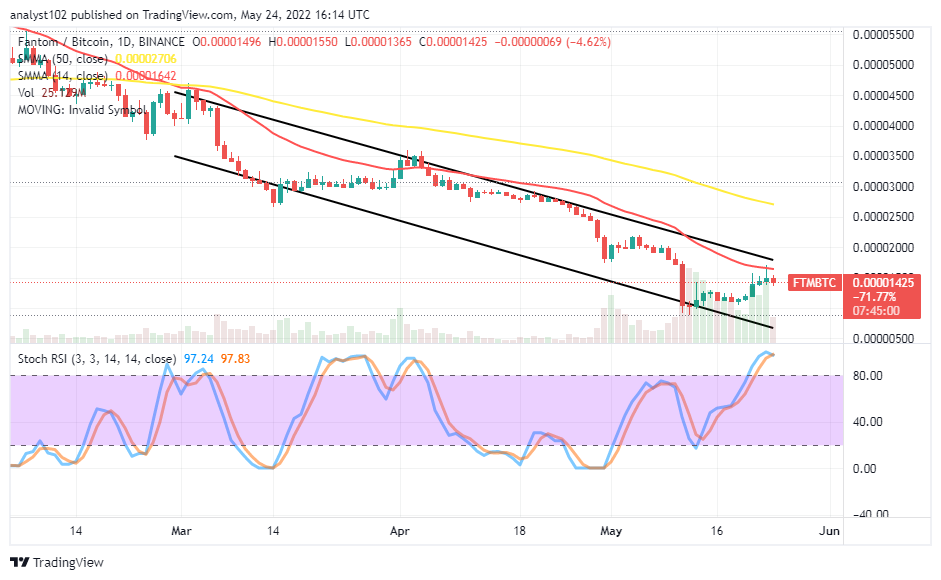
FTM/BTC Price Analysis
In comparison, Fantom (FTM) market worth may keep debasing against the trending strength of Bitcoin (BTC) for some time. The cryptocurrency pair market has been trending bearish over several sessions. The downward-trending outlook increases in the womb of time as the 14-day SMA indicator is underneath the 50-day SMA indicator. The Stochastic Oscillators are in the overbought region with their lines closed to raise the psychological point of viewing, negating the possibility of witnessing some ups more. That signifies the base crypto may soon begin losing a stance to the counter crypto.
Read more:
Join Our Telegram channel to stay up to date on breaking news coverage