
Join Our Telegram channel to stay up to date on breaking news coverage
Ethereum price was trading below key resistance levels just below $1,400 after dropping 8.5% in the past 24 hours. The largest altcoin by market capitalization was down 10.58% over the past week and more than 5% in the last 30 days. The buyers had just lost a key support level as the technical setup revealed that ETH was at risk of further losses and here are a couple of reasons why.
Reasons Why Ethereum Price May Remain Bearish
-
Collapse Of Crypto-friendly Bank Silvergate
Silvergate, a California-based crypto-friendly bank, has announced that it is entering into voluntary liquidation. The announcement was made on the bank’s official website on March 8 saying it “believes that an orderly wind down of Bank operations and a voluntary liquidation of the Bank is the best path ahead.
Today, Silvergate Bank has initiated voluntary liquidation procedures. We will continue to monitor the situation & meticulously assess compliance with all financial regulations and safety standards in collab w/ relevant Fed counterparts. https://t.co/7i8dHo5Rae#CryptoNews #Banks pic.twitter.com/Y3NEiESauf
— CA Department of Financial Protection & Innovation (@CaliforniaDFPI) March 8, 2023
The bank Silvergate explained that:
The wind down and liquidation plan of the Bank provides for the complete refund of all deposits. The business is also thinking about the best ways to settle disputes and protect the remaining value of its assets, particularly its in-house technology and tax assets.
Afterward, Silvergate’s share price plunged more than 42% to the current price of $3.08, a record low. This marks a 98.6% drop from its November 2021 peak of $219.75.
The collapse of Silvergate Bank is not the only macro factor adding possible strong headwinds for the Ethereum price.
President Joe Biden’s supplementary budget explainer on Thursday also released that US crypto miners could be subjected to a 30% tax on the cost of electricity under the budget proposal aimed at reducing crypto mining activity in the country.
This has also added to the selling pressure that has seen Bitcoin (BTC), the world’s first cryptocurrency, drop below the $20,000 mark after losing 8.25% of its value in the last 24 hours. The overall crypto market value has also lost the $1 trillion anchor, dropping 6.93% over the same period to $924.23B.
If the bloodbath continues, other top-cap cryptos like Ethereum will follow suit until positive developments in the space emerge occasioning a recovery.
2. The Technical Set Up Points To a Continued Downtrend
The smart contract’s cryptocurrency started recovering on January 1, making a 46% leap upward. The buyers tried to sustain the price above $1,700 but were rejected by overhead pressure from this supplier congestion zone.
When the ETH price turned away from this level, it recorded a series of lower highs and lower lows, flipping significant support levels into resistance as shown in the chart below. Ether’s price action had led to the appearance of an ascending triangle but Wednesday’s bloodbath saw the price drop below this technical pattern. This meant that a correction was inevitable, threatening the return of the crypto’s price to January 1 levels.
At the time of writing, the Ethereum price was trading in a fourth straight bearish session below the triangle and had lost the support provided by major moving averages, meaning increased selling from the current level could send it tumbling below the major support level at $1,300 toward $1,000. This would represent a 23.44% drop from the current price.
ETH/USD Daily Chart
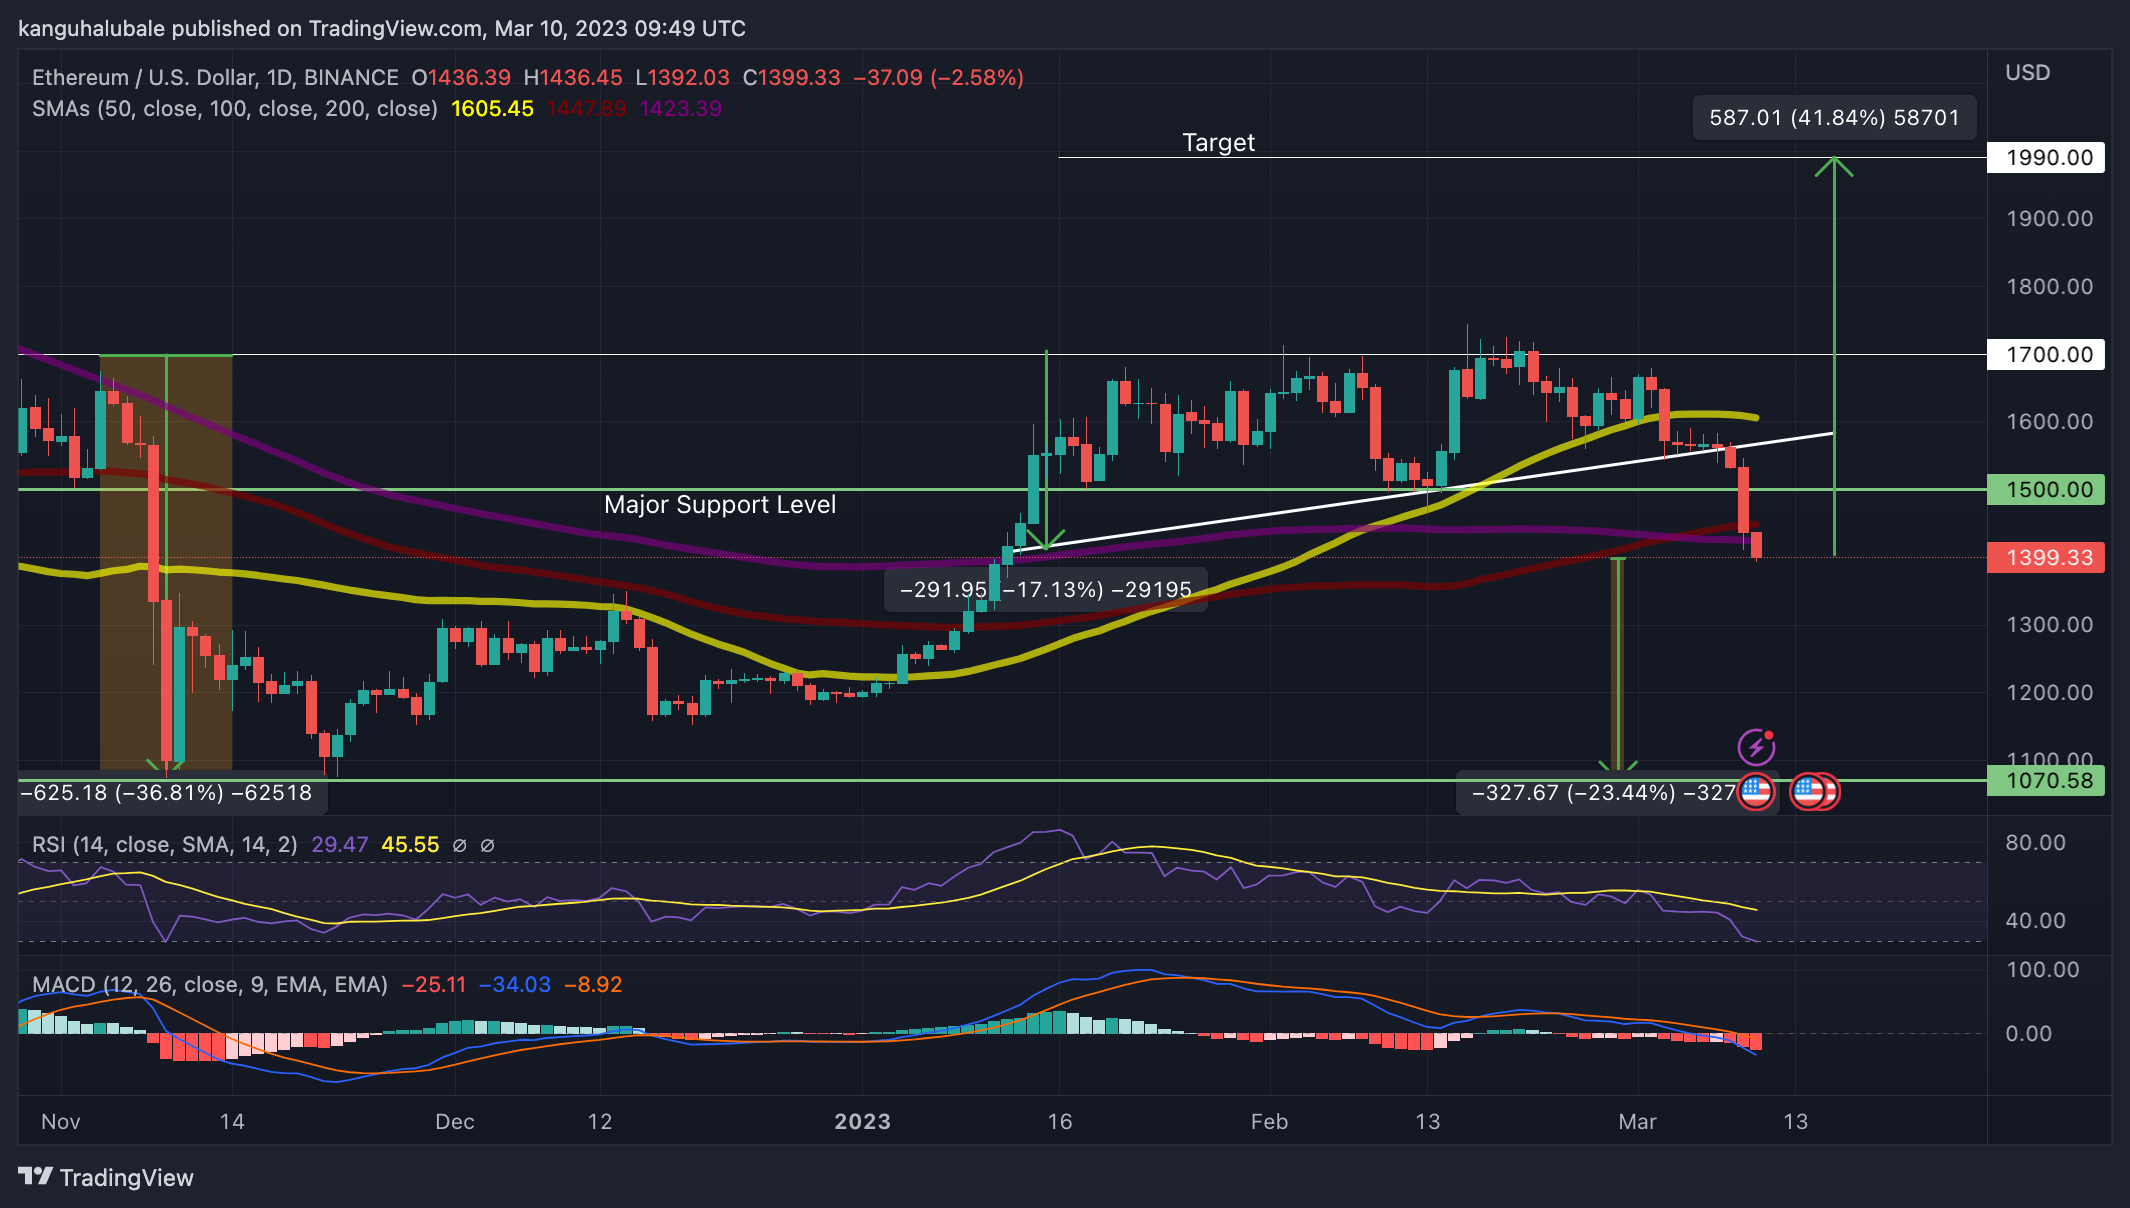
Ethereum’s bearish narrative was supported by the downward-facing 50-day SMA and the position of the MACD below the zero line into the negative region. This implied that the market still favored the sellers. Ether’s downtrend would gain momentum once the MACD moves deeper into the negative territory.
The Relative Strength Index (RSI) was also moving downward and had just entered the oversold region. The price strength at 29 suggested Ether was firmly under the control of sellers.
The technical formation also revealed that the Ethereum price has been struggling with recovery since late January because of the relatively robust resistance on the upside. These were the $1,610 where the 50-day Simple Moving Average (SMA) sat and the $1,700 supply zone, embraced by the triangle’s horizontal line.
Notice that the last time ETH was rejected by this barrier was in November last year when the FTX collapse sent prices on a downward spiral. The Ethereum price plummeted 36% to lows around $1,070. If a similar scenario plays out, the ongoing sell-off could be extended toward $1,000.
3. On-Chain Metrics Attest To The Stiff Resistance
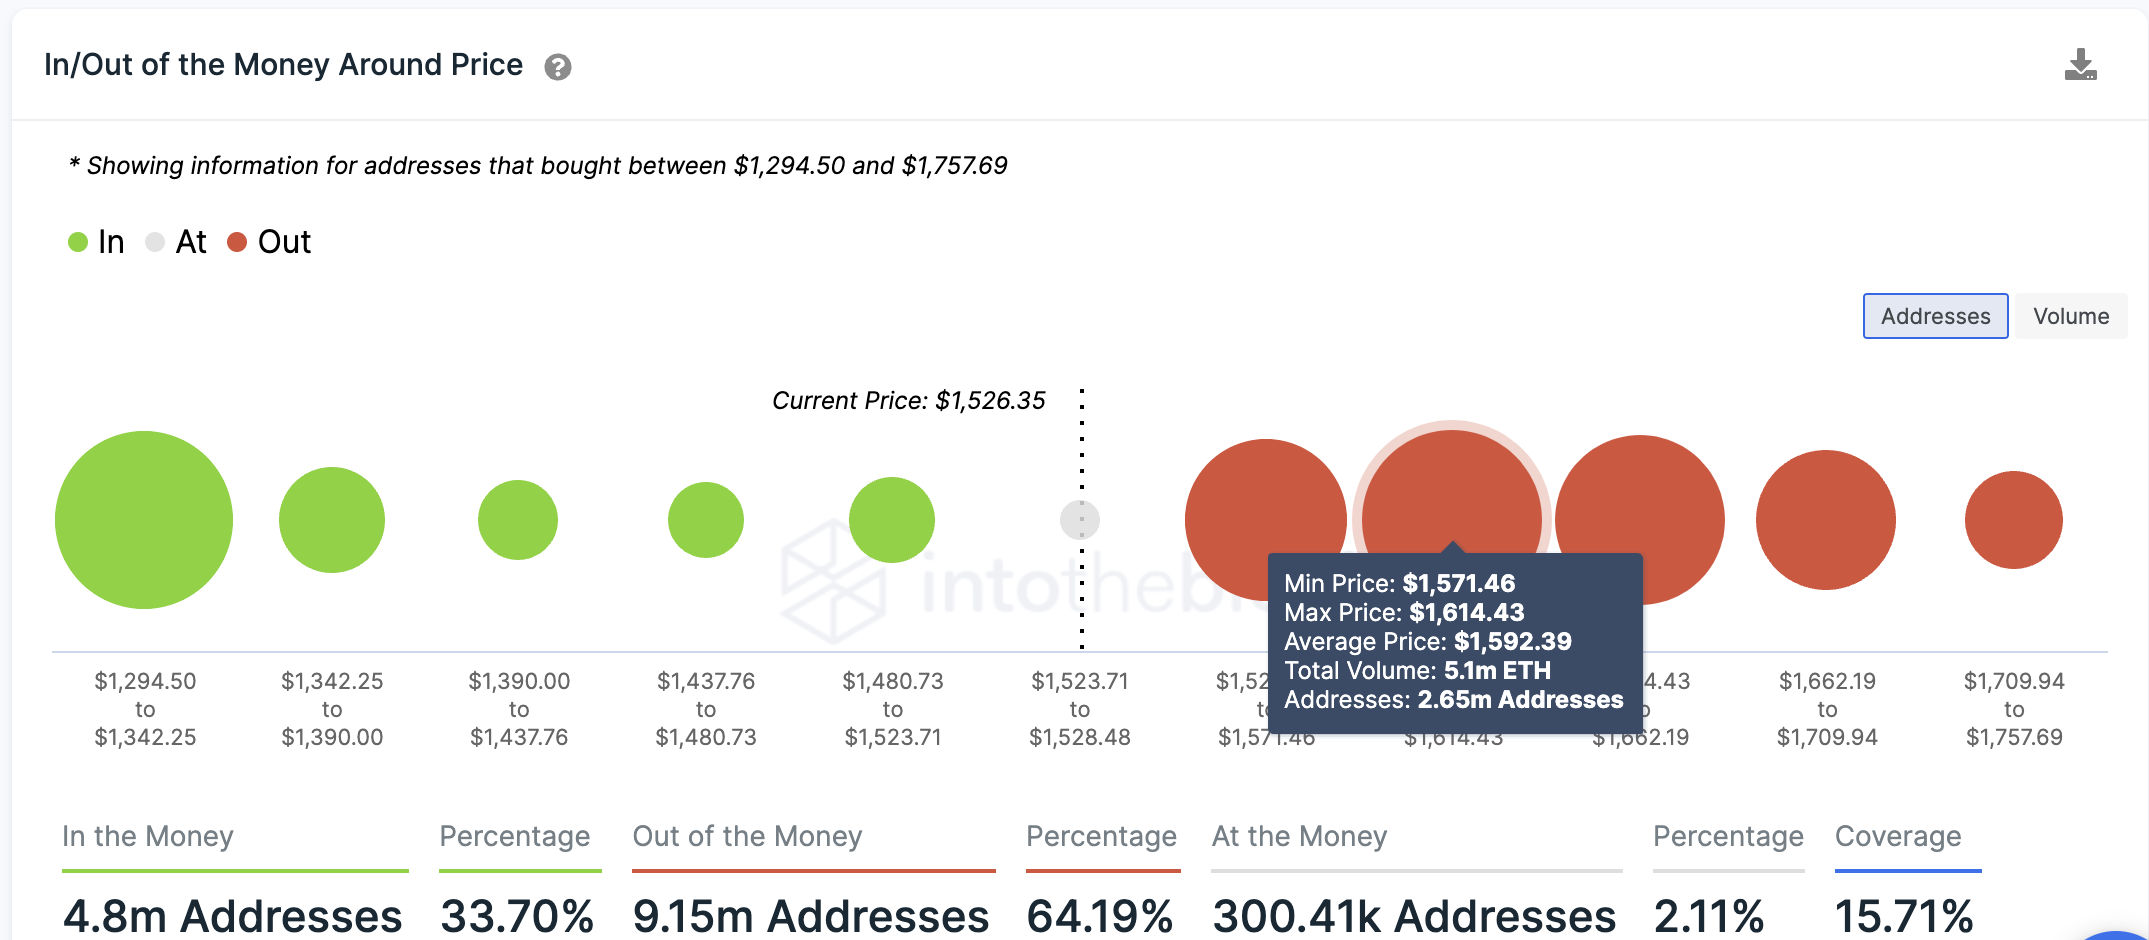
The most crucial area of resistance is the one defined by the 50-day SMA above $1,605. The importance of this supplier congestion zone was reinforced by on-chain metrics from IntoTheBlock, a blockchain data analytics firm. Its In/Out of the Money Around Price (IOMAP) model showed that this resistance is relatively stiff compared to the areas of support that the coin sat on.
This area lies within the $1,571 and $1,614 price range where roughly 2.65 million addresses previously bought approximately 5.1 million ETH. Any attempts to push the price above the 50-day SMA would be met by immense selling from this cohort of investors who may wish to break even. The ensuing supply pressure would cause Ether to drop even further.
Ethereum’s IOMAP Chart
Noteworthy, if bulls can regain control of the price, the token may abandon the ongoing correction, rising above the $1,500 psychological level and the SMAs. The next move higher would see Ethereum rise above the triangle’s resistance line at $1,700, confirming a bullish breakout.
This would clear the path for ETH to climb higher toward the technical target of the governing chart pattern at $1,990 bringing the $2,000 psychological level into the picture. Market participants could expect the upside for the most significant crypto by market capitalization to be capped here in the short term
Promising Alternatives To ETH
The technical setup showed that the proof-of-stake token was on the brink of an extended correction if the current correction was not stopped. In the meantime, traders could consider FGHT, the native token of the Fight Out ecosystem, which has been performing well in presale.
The network’s FHGT token is currently in the last few hours of stage 2 of its presale with more than $5.38 million raised so far.
$5.3M RAISED 🔥🤯
Things are heating up as we get closer to the end of our #Presale ⏰
Don't miss your chance to get in early and claim your BONUS with $FGHT!
Join the #FightOut presale now ⚡️
👉https://t.co/9pikKGRjSd#Blockchain #Web3 #Crypto #P2E #P2EGame pic.twitter.com/GodcGbo2V4— Fight Out (@FightOut_) March 8, 2023
Fight Out is a move-to-earn (M2E) platform where users complete tasks that promote fitness and healthy living, earning rewards in return. Fight Out employs the M2E technology and utilizes an algorithm that tracks a user’s crucial data movement and effort, sleep, and diet. These are all geared towards developing a user’s profile fitness so that more customized training regimens can be provided.
Visit Fight Out here to find out more about how you can participate in the ongoing presale.
Related News:
- Fight Out Offers Authentic Athlete Stories on Web3 Platform – Best Presale in 2023?
- Gate.Io Launches A Visa Crypto Debit Card In Europe
- How to Buy Cryptocurrencies
Best Wallet - Diversify Your Crypto Portfolio

- Easy to Use, Feature-Driven Crypto Wallet
- Get Early Access to Upcoming Token ICOs
- Multi-Chain, Multi-Wallet, Non-Custodial
- Now On App Store, Google Play
- Stake To Earn Native Token $BEST
- 250,000+ Monthly Active Users
Join Our Telegram channel to stay up to date on breaking news coverage