Join Our Telegram channel to stay up to date on breaking news coverage
XRP Price Prediction – May 5
The price of Ripple is improving as the coin is now consolidating in an intraday zone between $1.36 and $1.69.
XRP/USD Market
Key Levels:
Resistance levels: $2.00, $2.20, $2.40
Support levels: $1.10, $0.90, $0.70
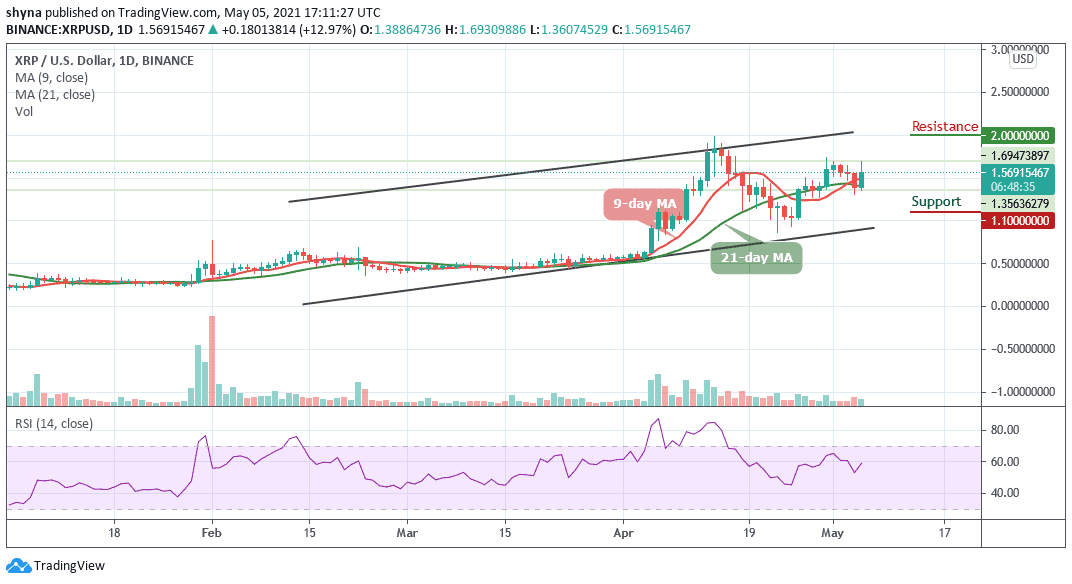
XRP/USD struggles to settle above the moving averages amid global recovery on the cryptocurrency market. The fifth-largest digital asset has gained nearly 12.97% in the recent 24 hours and touched the intraday high at $1.69 before retreating to $1.56. At the time of writing, the coin is floating above the 9-day and 21-day moving averages as the RSI (14) indicator moves to cross above the 60-level.
What is the Next Direction for Ripple?
Looking at the daily chart above, we can see that the red-line of 9-day MA is crossing above the green-line of 21-day MA to resume an upward movement. However, a breakout above 60-level could dictate the direction in which XRP/USD may be heading towards the upside. If the price collapses beneath the range, it may turn bearish and a break above this range could start to put the Ripple (XRP) back on the bullish footing.
Moreover, XRP needs to break the current range for it to break out of the neutral trading condition. If buyers can keep the movement above the moving averages, the first level of resistance at $1.80 level could be reached. However, any further movement above this may hit the potential resistance at $2.00, $2.20, and $2.40 levels. On the downside, the support at $1.30 should hold the moving forward. If the market pushes beneath, the market may turn bearish and further support levels could be reached at $1.10, $0.90, and $0.70 respectively.
When compares with BTC, XRP is trading above the 9-day and 21-day moving averages. Meanwhile, the price action has remained intact above this barrier and if the selling pressure steps back, XRP/BTC price variation may create a new low. At the moment, the technical indicator RSI (14) faces the upside; we may continue to see a positive move in the market.
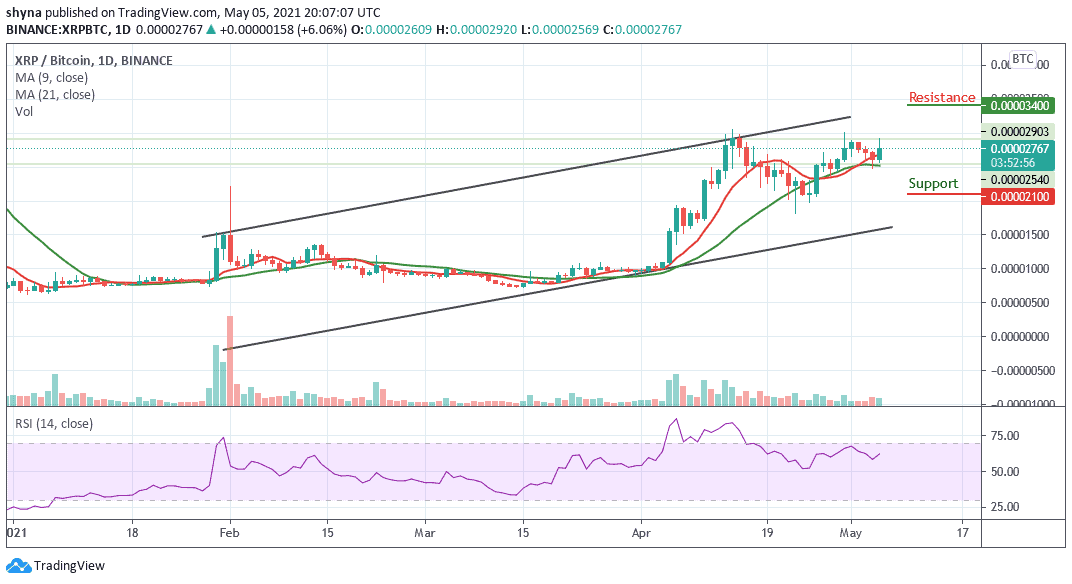
However, as the daily chart reveals, XRP/BTC is currently moving at 2643 SAT which is around the lower boundary of the channel. Traders may expect close support at 2400 SAT before breaking to 2300 SAT and critically 2200 SAT levels. Should in case a bullish movement occurs and validates a break above the 9-day moving average; we can then confirm a bullish movement for the market and the nearest resistance levels to reach lies at 2850 SAT and above.
Join Our Telegram channel to stay up to date on breaking news coverage