Join Our Telegram channel to stay up to date on breaking news coverage
Bitcoin (BTC) Price Prediction – May 5
Bitcoin gains 7.36% as bulls keep working hard to nurture a bullish trend from the support at $53,000.
BTC/USD Long-term Trend: Ranging (Daily Chart)
Key levels:
Resistance Levels: $60,000, $62,000, $64,000
Support Levels: $49,000, $47,000, $45,000
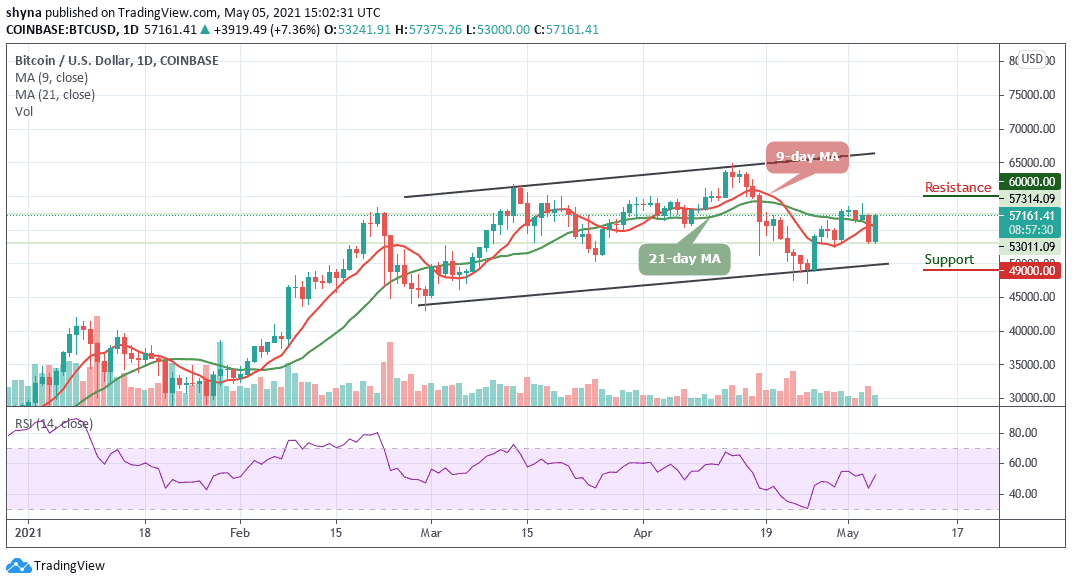
BTC/USD is currently trading at the $57,161 resistance level. The market price is trading above the 9-day and 21-day moving averages, indicating an upward movement in cryptocurrency. For the past few days, the Bitcoin price has been towards the south and in the context of the Bitcoin exchange rate forecast; an application of $60,000 is expected.
Will BTC Break Above $60,000 Resistance Level or Reverse?
If the Bitcoin price can retain the upward movement above the moving averages, it is likely for the market price to touch the $60,000 level. This is where traders should expect buyers to fight for a further rise in BTC/USD and further development of the bullish trend. However, the purpose of this movement is to provide a level of resistance close to $65,000.
However, the best area for traders to buy BTC is when the red-line of 9-day MA crosses above the 21-day MA and when the price rises to a resistance level of $58,000 while the technical indicator RSI (14) signal line is considering the way above 60-level. Meanwhile, looking at the market movement, there is likely that it may experience a quick retracement or sell-off just in case it touches the crucial $60,000 level but if not; traders may see additional resistance levels of $62,000 and $64,000 before pushing higher.
On the downside, if the market decides to fall, the price of Bitcoin could fall below the moving averages at $55,000, and if that support fails to hold the sell-off, BTC/USD could see a further decline towards the support levels of $49,000, $47,000, and $45,000. As reveals by the technical indicator, the market may gain more if the RSI (14) crosses above the 60-level.
BTC/USD Medium – Term Trend: Bullish (4H Chart)
On the 4-hour chart, traders expect the coin to gain the lost momentum and hit the trade above $60,000. On the contrary, if the selling pressure still exists and holds the coin not to be able to cross above the moving averages, the $55,500 and below may come into play.
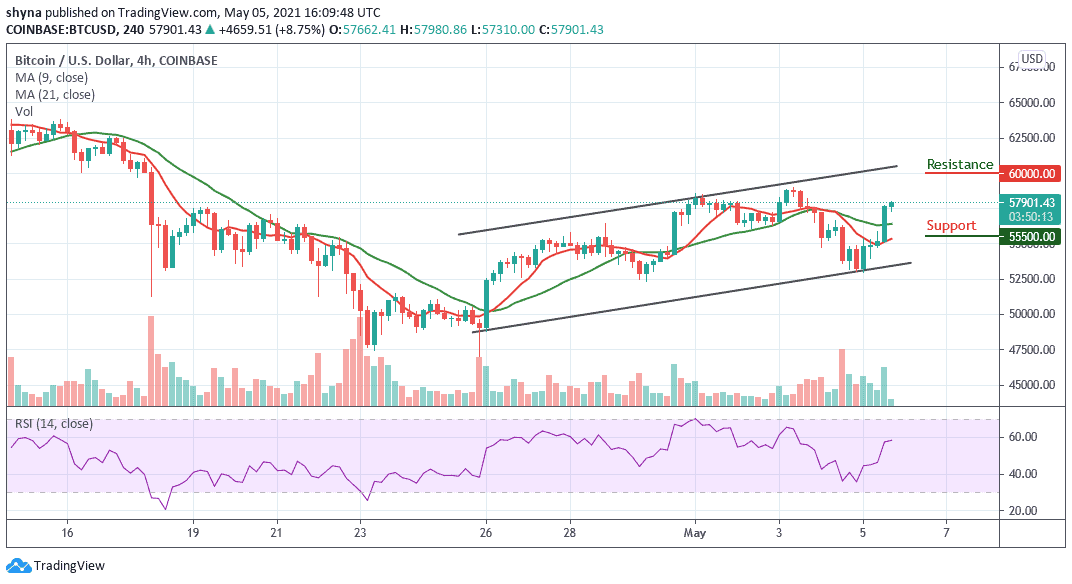
However, in as much as the buyers keep the price above the moving averages, traders may expect a strong bullish movement that could hit the resistance at $60,000 and above. Meanwhile, the technical indicator RSI (14) is moving around 58-level, suggesting that more bullish signals may play out.
Join Our Telegram channel to stay up to date on breaking news coverage