Join Our Telegram channel to stay up to date on breaking news coverage
XRP Price Prediction – April 25
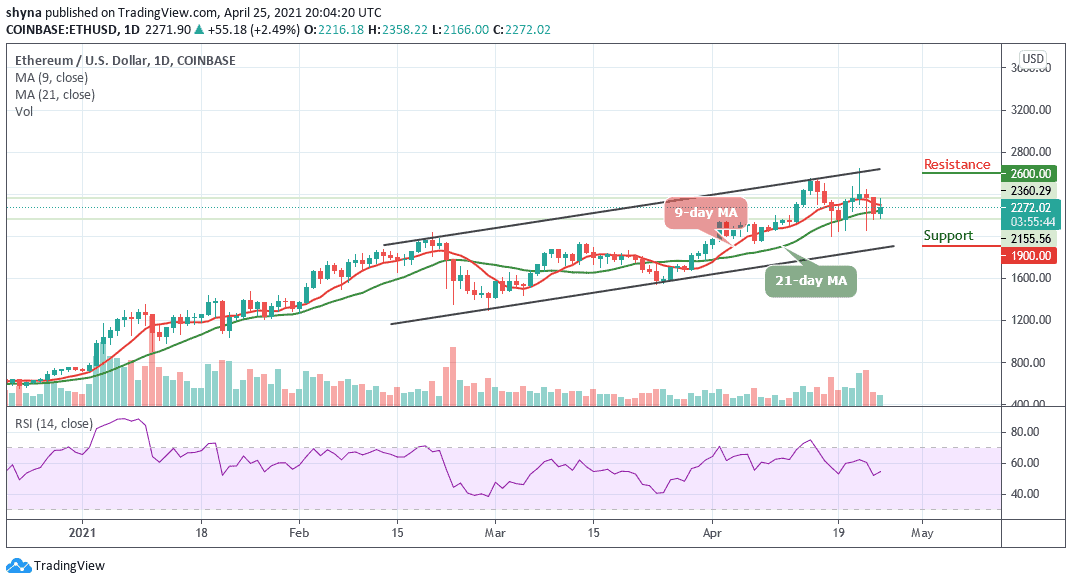
XRP/USD has not been able to maintain the upside momentum above the $1.16 resistance level.
XRP/USD Market
Key Levels:
Resistance levels: $1.50, $1.60, $1.70
Support levels: $0.50, $0.40, $0.30
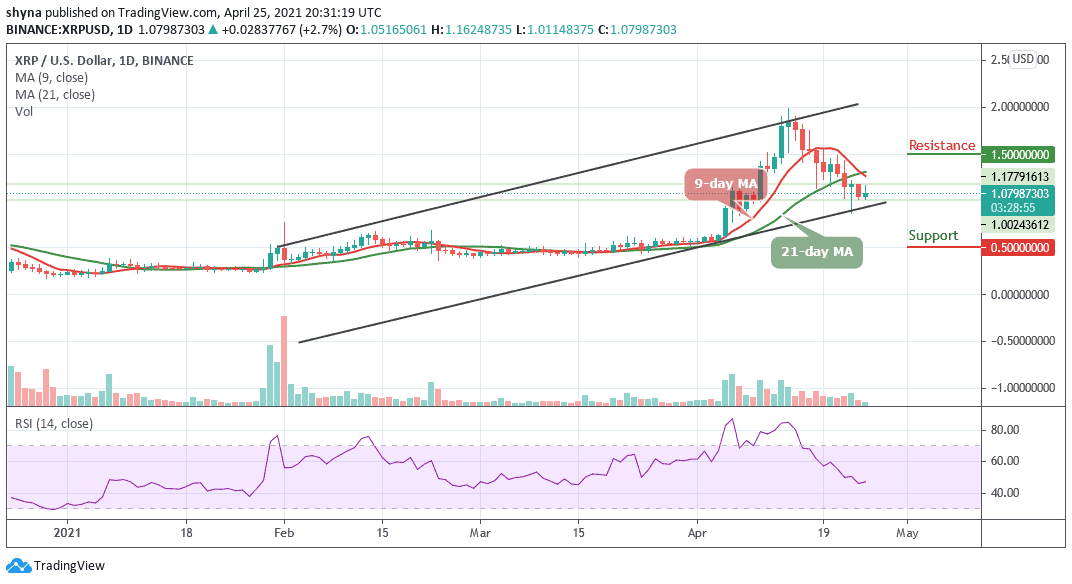
XRP/USD moves toward the 9-day and 21-day moving averages at the opening of the market today, but failed to hold the ground and retreated quickly towards $1.07 at the time of writing. Meanwhile, XRP/USD has been mostly unchanged both on a day-to-day basis since the beginning of today’s trading. XRP/USD now remains at a tight range that limited its bullish movements since April 16.
What Is XRP Price Going to Do Next?
The Ripple price is struggling to cross above the moving averages. If the price fails to cross above this barrier, it is likely to resume its decline. Meanwhile, the first major support is near the lower boundary of the channel, falling below it could revisit the main $0.85 support. Any further losses may perhaps start a significant decline towards the $0.50, $0.40, and $0.30 support levels.
From above, the initial resistance remains above the moving averages as the daily chart reveals. More so, to start a new increase, the price must surpass the $1.20 and $1.30 resistance levels. Any further gains could lead the price towards the $1.50, $1.60, and $1.70 resistance levels. However, the technical indicator RSI (14) is seen moving in the same direction around the 46-level, suggesting sideways movement for the market.
When compares with Bitcoin, the Ripple market price is ranging and trading below the 9-day and 21-day moving averages. For now, the coin is finding it difficult to break above the moving averages. Looking at the chart, both the bulls and the bears are struggling on who will dominate the market as the RSI (14) move sideways above the 50-level.
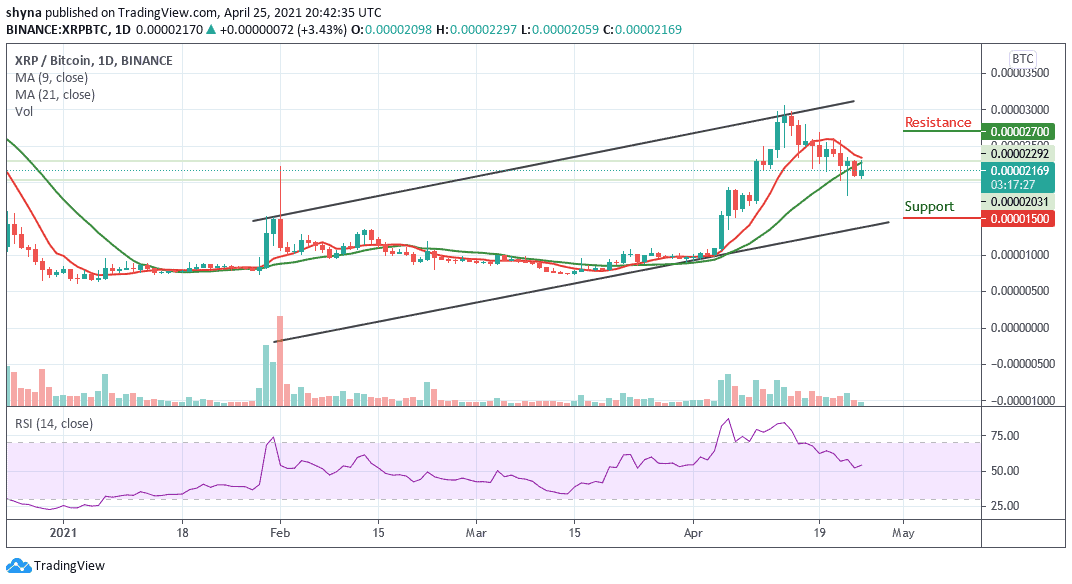
However, should the price fall towards the lower boundary of the channel, the next key support level could be 1500 SAT and below. Meanwhile, on the bullish side, a possible rise above the moving averages may likely take the market to the resistance levels of 2700 SAT and above.
Join Our Telegram channel to stay up to date on breaking news coverage