Join Our Telegram channel to stay up to date on breaking news coverage
ETH Price Prediction – April 25
Ethereum (ETH) remains in the buy phase despite the recent price falls that hit the crypto market in the last few days.
ETH/USD Market
Key Levels:
Resistance levels: $2600, $2700, $2800
Support levels: $1900, $1800, $1700
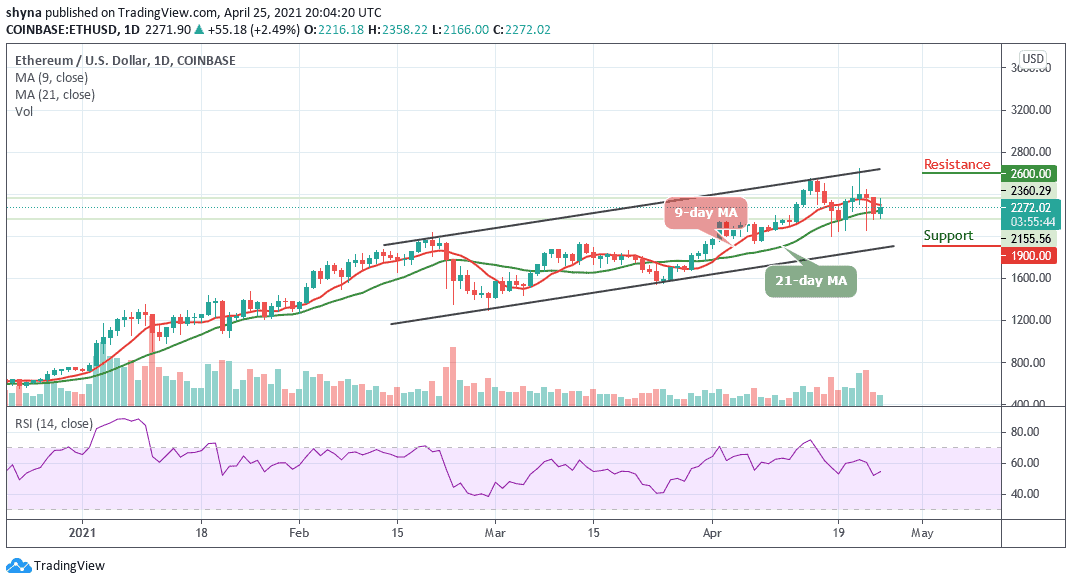
ETH/USD has been gaining ground since the beginning of the day. The coin hits an intraday high at $2358.22 but retreated to $2166 at the time of writing. Despite the slight downside correction, ETH/USD is still nearly 2.49% higher on a day-to-day basis. At the moment, Ethereum (ETH) is trading at $2272.02 while the 9-day MA is trying to cross below the 21-day MA.
What is the Next Direction for Ethereum?
According to the daily chart, the initial support is created below the moving averages at $2100. Once this is eliminated, the sell-off may increase with the next focus on the $2000 level. If this support level drops, the downward momentum could begin to snowball, and the next downside could target the closest supports at $1900, $1800, and $1700.
Moreover, as the daily chart reveals, bulls must realize the need to remain above the moving averages before they can get to the potential resistance levels. Above this handle, traders will need to consider a sustained move for the extended recovery to the resistance levels at $2600, $2700, and $2800. Meanwhile, the RSI (14) moves above the 50-level, which may give more bullish signals and this could only be possible if the 9-day MA remains above the 21-day MA.
When compares with BTC, buyers are making effort to step back into the market as the coin is making an attempt to show some promising signs if the price remains above the 9-day and 21-day moving averages. On the upside, the nearest resistance level lies at 0.050 BTC and above.
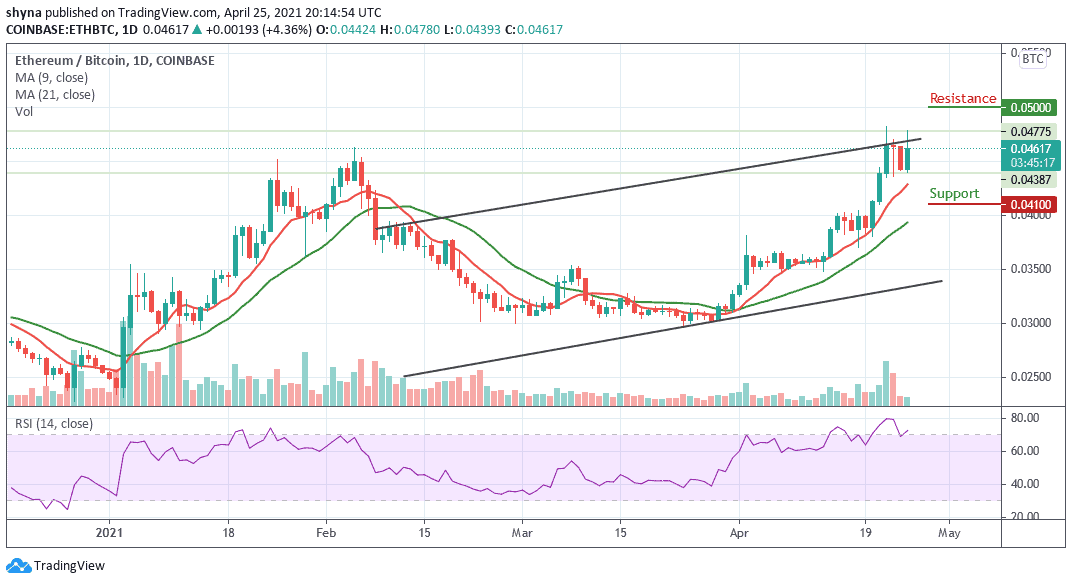
Moreover, when looking from the downside, the nearest support level is around 0.045 BTC and beneath this, further support lies at 0.043 BTC. If the price drops further to create another low, lower support is located at 0.041 BTC and below. The RSI (14) is moving back into the overbought region which indicates that bulls may continue to dominate the market.
Join Our Telegram channel to stay up to date on breaking news coverage