Join Our Telegram channel to stay up to date on breaking news coverage
XRP Price Prediction – March 17
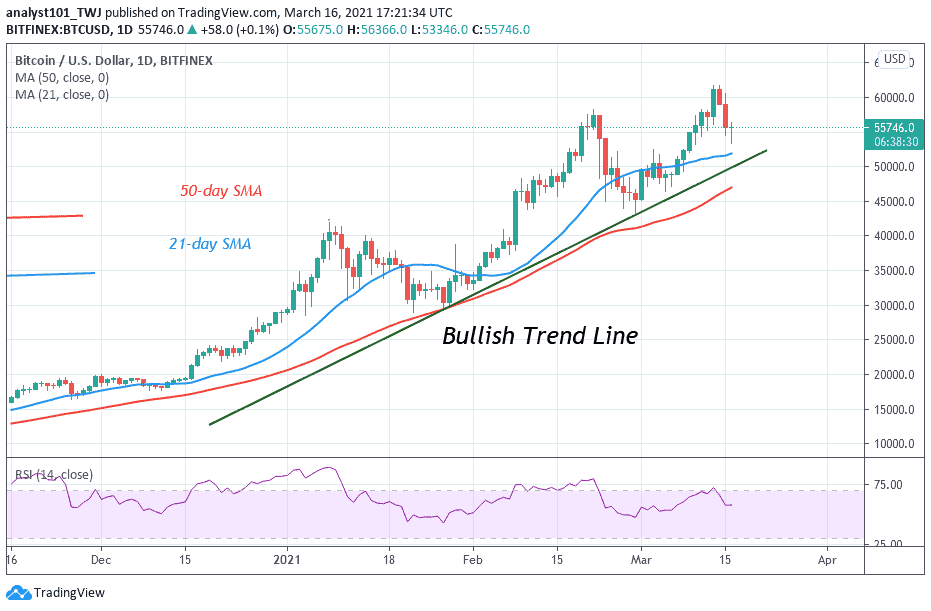
XRP/USD has been following sideways movement over the past few days as the coin now appears to be resuming a bullish run.
XRP/USD Market
Key Levels:
Resistance levels: $0.56, $0.58, $0.60
Support levels: $0.39, $0.37, $0.35
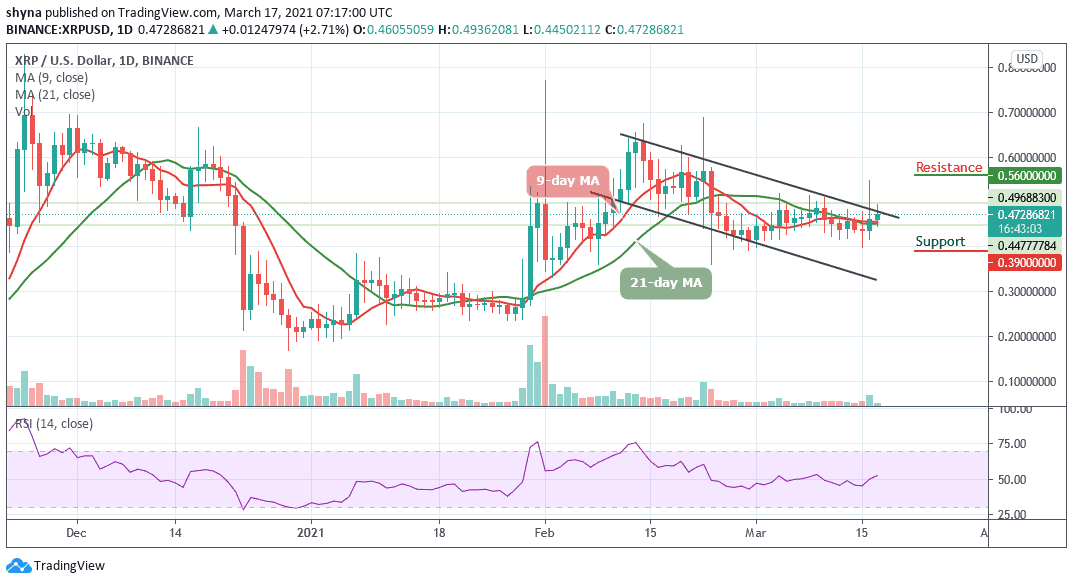
XRP/USD has seen a small increase of around 2.71% as the market opens today and it currently trades at $0.47 above the 9-day and 21-day moving averages. The coin still has hard times moving above the $0.55 level as the previous attempts so far have failed. Despite this, XRP/USD is still making an effect to cross above the upper boundary of the channel.
Where is XRP Price Going Next?
Since yesterday, the Ripple price has remained relatively strong to the extent that it trades above the vital $0.50 have been acutely steady. At the same time, the movement to a downward trend has been cut short as reveals by the technical indicator. In the early hours of today, the Ripple price touches the low of $0.44 but still maintaining the bullish movement. Therefore, bulls had already taken the price up to $0.49 before the bears step back and taking it down.
However, a significant cross above the channel could sustain the bulls to a $0.50 high. Meanwhile, if XRP manages to surge above $0.50, it may see the resistance levels at $0.56, $0.58, and $0.60, though a further drop may take the price to the support levels $0.39, $0.37, and $0.35. The RSI (14) indicator is showing some bullish signals by crossing above 50-level.
Against Bitcoin, before this time, the market price was moving bearishly and trading below the 9-day and 21-day moving averages. For now, XRP/BTC is trading at 836 SAT and expecting a break above the upper boundary of the channel. Now, mere looking at the daily chart, the bulls are now struggling to push the market price above the moving averages.
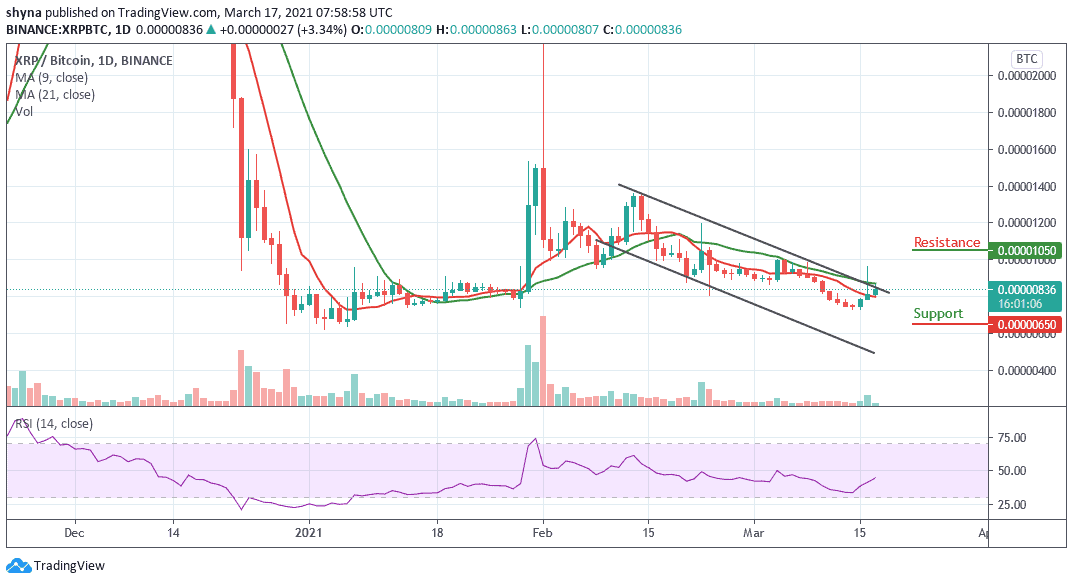
However, if the market drops below the 9-day MA, the next key supports may likely be at 650 SAT and below. On the bullish side, a possible rise could push the market to the resistance level of 1050 SAT and above. According to the technical indicator RSI (14), the market is moving in an upward trend as the signal line aims to cross above the 50-level, which could trigger more bullish signals in the market soon.
Read more:
- XPTUSD Is Targeting the Supply Level of $898
- Bitcoin Price Prediction: BTC/USD Fails to Touch $11,700; the Bulls May Need to Wait a Bit
Join Our Telegram channel to stay up to date on breaking news coverage