Join Our Telegram channel to stay up to date on breaking news coverage
Bitcoin (BTC) Price Prediction – August 30
The Bitcoin (BTC) is focusing on the north but the Bulls may have trouble taking the price above $11,800.
BTC/USD Long-term Trend: Bullish (Daily Chart)
Key levels:
Resistance Levels: $12,200, $12,400, $12,600
Support Levels: $11,000, $10,800, $10,600
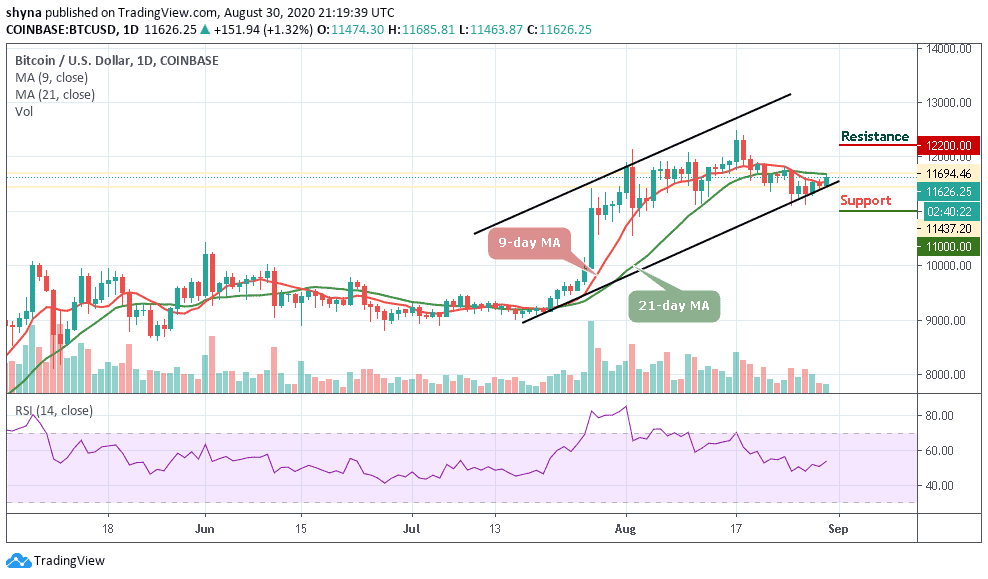
BTC/USD faces the upside trend as the market opens in the early hours of today. At the time of writing, BTC is changing hands at $11,626 and the upside momentum is gaining traction little-by-little. A sustainable move above $11,800 could bring $12,000 back into focus and improve the technical picture. The coin after touching $11,685 has gained around 1.32% since the beginning of the day but now trading at $11,626.25.
What Is the Next Direction for Bitcoin?
Looking at the daily chart, BTC/USD is moving in-between the 9-day and 21-day moving averages. However, BTC/USD may retest $11,500 before another attempt at $11,800 but if $12,000 plays out, the nearest resistance level of $12,200 may come into focus, followed by $12,400 that may serve as a strong resistance before getting to the potential resistance at $12,600.
Therefore, any failure by the bulls to move the price up, we may see a price cut to $11,300 vital support. A further low drive could send the price to $11,000, $10,800, and $10,600 supports. For now, the RSI (14) is facing the north while the bulls are seen coming back into the market. Meanwhile, the Bitcoin bulls may not last long in the market in as much as the red-line of 9-day MA is below the green-line of 21-day MA.
BTC/USD Medium-Term Trend: Bullish (4H Chart)
At the opening of the market today, the Bitcoin price first went up to touch $11,684 but has dropped slightly within 24 hours, bringing its price to where it is currently trading at $11,609. Should the price continue to drop further and move below the 9-day and 21-day moving averages, it could reach the nearest support levels at $11,400 and below.
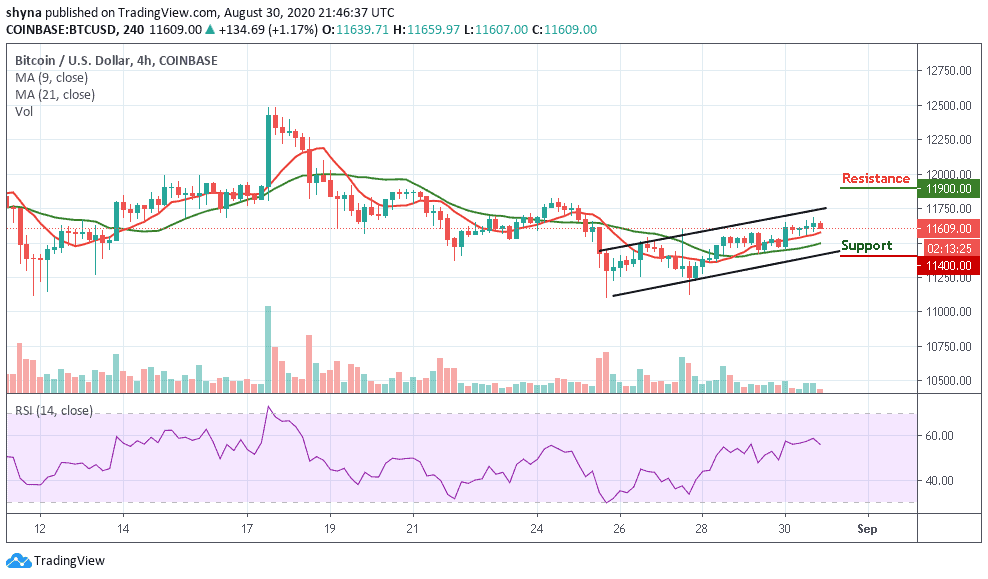
However, if the bulls push the coin above the channel, the price of Bitcoin may likely hit the potential resistance at $11,900 and above. Presently, the market may follow the downward trend as the RSI (14) indicator nosedives below the 58-level.
Join Our Telegram channel to stay up to date on breaking news coverage