Join Our Telegram channel to stay up to date on breaking news coverage
XRP Price Prediction – August 30
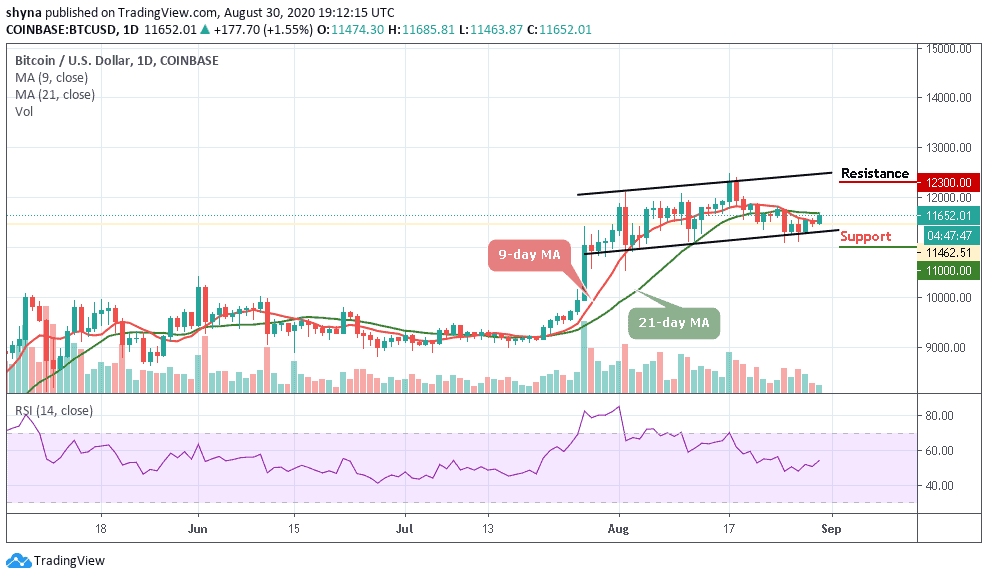
Today, the Ripple (XRP) price is trading in the positive territory, with gains of over 3.06%.
XRP/USD Market
Key Levels:
Resistance levels: $0.31, $0.32, $0.33
Support levels: $0.25, $0.24, $0.23
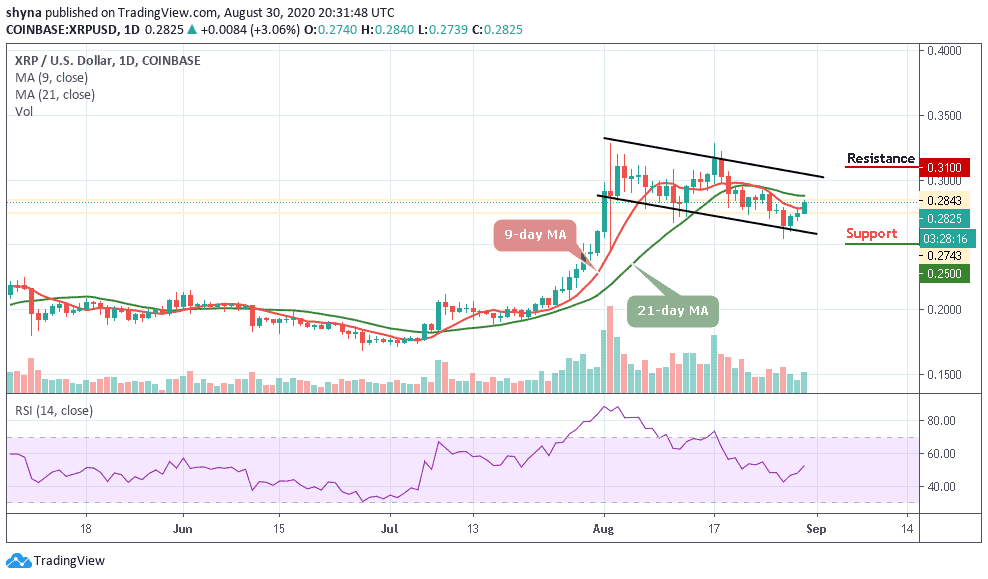
XRP/USD jumped from $0.273 to the area above $0.280 in a matter of hours and touched an intraday high at $0.284 as the coin remained focused, the pair retains bullish momentum. In the short term, XRP/USD has gained more than 3.06% within 24 hours and currently trading above the 9-day moving average but below the 21-day moving average.
Will XRP Break Through $0.30 Resistance Level or Reverse?
The daily chart reveals that due to a strong upside movement of the coin, Ripple’s XRP broke free from the recent low on August 27 at $0.255 and tested the highest level today. The lower boundary of the descending channel now serves as strong support for the coin. If it is broken, the sell-off may be extended to $0.25, $0.24, and $0.23 support levels.
Moreover, the technical indicator RSI (14) is moving tremendously above 50-level and giving more bullish signals. Similarly, if XRP/USD manages to break above the moving averages and touch the nearest resistance at $0.295, the market may fuel a bull-run and cross above the upper boundary of the channel to reach the resistance levels of $0.31, $0.32, and $0.33s. As it stands now, the bulls appeared to be stepping back into the market.
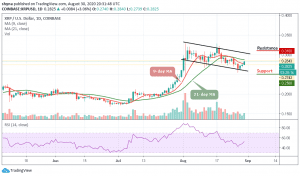
When compared with Bitcoin, Ripple (XRP) is seen demonstrating some positive signs across the market. Actually, the daily price movement is perpetually looking bullish in the long-term while crossing the 9-day moving average within the descending channel. XRP/BTC is currently changing hands at 2429 SAT after witnessing some bearish movement some weeks ago.

Meanwhile, the resistance levels to look for are 2560 SAT, 2750 SAT and 2850 SAT while the closest support levels are located at the supports of 2200 SAT, 2100 SAT, and critically 2000 SAT. The technical indicator RSI (14) is on the positive side, moving above 50-level to confirm the bullish movement.
Join Our Telegram channel to stay up to date on breaking news coverage