

Join Our Telegram channel to stay up to date on breaking news coverage
Bitcoin (BTC) Price Prediction – August 30
Today, the Bitcoin (BTC) bulls moved against the USD at numerous levels which almost touched $11,700.
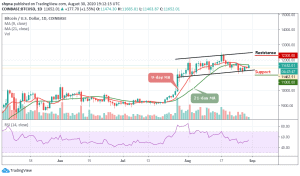
BTC/USD Long-term Trend: Bullish (Daily Chart)
Key levels:
Resistance Levels: $12,300, $12,500, $12,700
Support Levels: $11,000, $10,800, $10,600

BTC/USD has resumed its upward movement after a brief dip on August 25 bringing the price from $11.081 to $11,685. A couple of days ago, BTC/USD hit just over $11,500 before retreating to a local low of around $11,402 yesterday. However, the decline was short-lived. Today, the price of the leading crypto asset is once again heading towards the north, in fact, it has returned above the 9-day moving average.
What is the Next for Bitcoin?
The price of Bitcoin is now moving above the crucial levels which will now function as the support zones in the event a reversal occurs. Meanwhile, on the upside, as the coin moves and breaks above the 21-day moving average, little is in place to prevent correction targeting the key resistance of $11,800 as the technical indicator RSI (14) moves above the 50-level.
Nevertheless, the coin is also banking on the support at $11,000, $10,800 and $10,600 to ensure that in spite of a reversal, the Bitcoin price stays above $11,500 level. Similarly, the nearest resistance levels to watch for are $12,300, $12,500, and $12,700 while the support levels to keep an eye on are $11,000, $10,800, and $10,600 respectively.
BTC/USD Medium – Term Trend: Bullish (4H Chart)
The 4-hour chart shows that the price will soon find its way upward as the RSI (14) is about crossing the 60-level. Although the bears are showing interest too, it is high time for the bulls to defend the $11,500 support and push the price above the channel to meet the potential resistance at $11,850 and above.
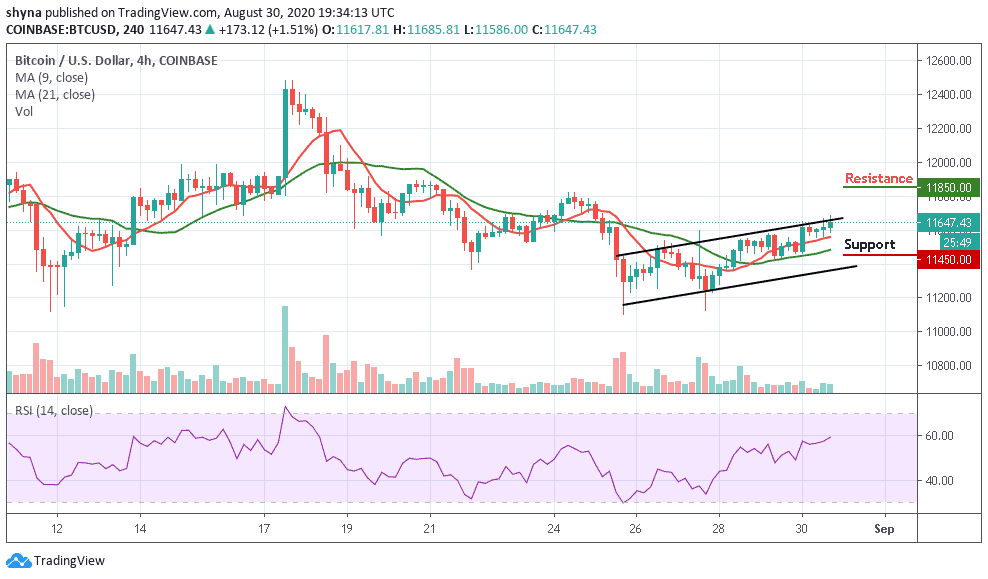
In other words, the support levels of $11,450 and below may come into play if the price breaks below the 9-day and 21-day moving averages within the ascending channel.
Join Our Telegram channel to stay up to date on breaking news coverage
