Join Our Telegram channel to stay up to date on breaking news coverage
XPTUSD Price Analysis – June 27
Platinum price is targeting the supply level of $898 and this may be achieved should the Bulls maintain or increase their pressure.
XPT/USD Market
Key levels:
Supply levels: $898, $962, $1,030
Demand levels: $833, $776, $714
XPTUSD Long-term trend: Bullish
XPTUSD is bullish on the weekly chart. After the bullish breakout experienced in the Platinum market last two weeks at $833 price level, followed by a retracement, the Bulls maintains their bullish momentum and the price increased further last week. A strongly weekly bullish candle emerged last week and the price moved towards the supply level of $898. The price pulled back briefly before the closing of last week market.
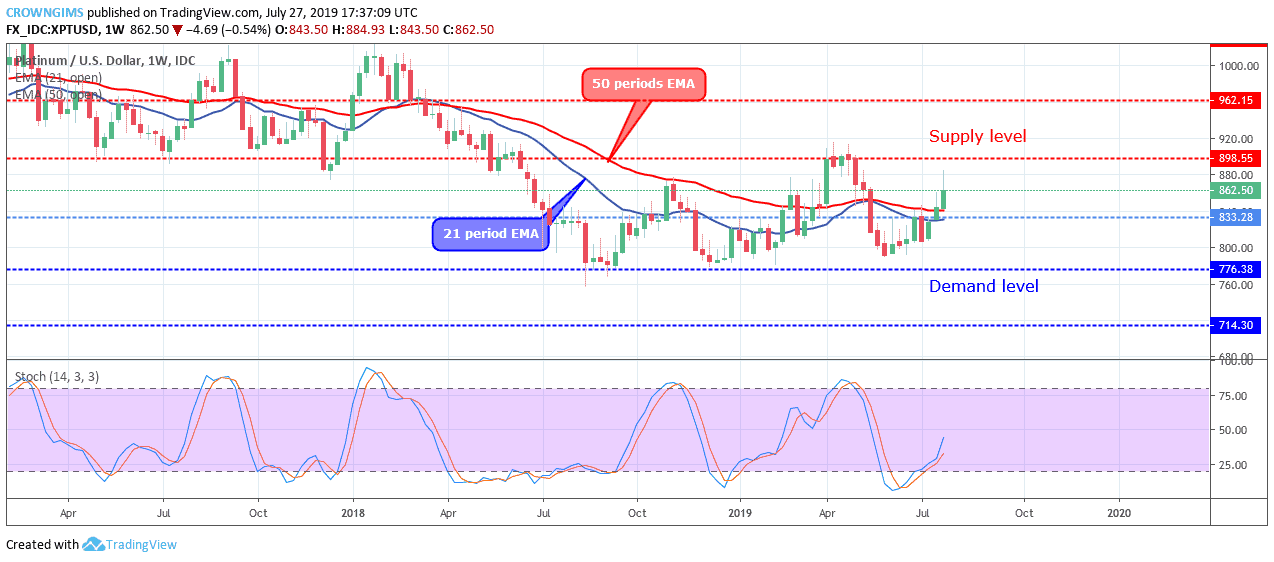
XPT price is trading above the 21 periods EMA and 50 periods EMA and the former is trying to cross the later upside to establishing a bullish trend. The stochastic Oscillator period 14 is at 40 levels with the signal line pointing up to indicate a buy signal. Platinum price is targeting the supply level of $898 and this may be achieved should the Bulls maintain or increase their pressure.
XPTUSD medium-term Trend: Bullish
XPTUSD is bullish in the medium-term outlook. There was a breakout of the Platinum price at $83 price level on July 15; this scenario was followed with a price retracement. The Bulls further pushed up the price towards the supply level of $898 but yet to reach the mark before the Bears interrupted and the price was pulled back.
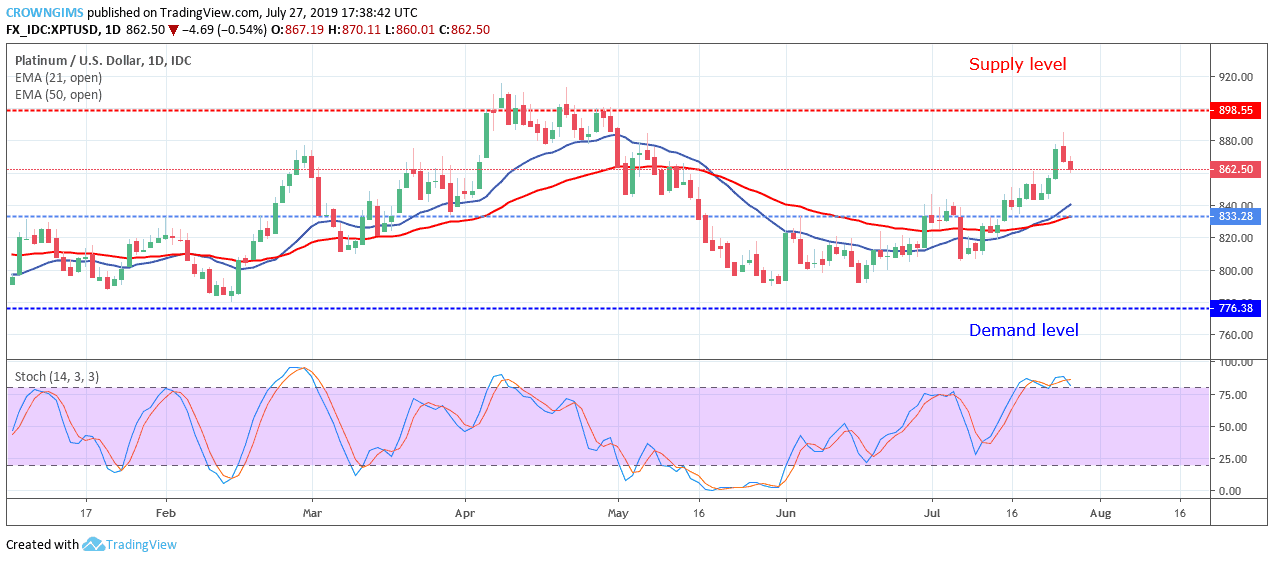
The 21 periods EMA has crossed the 50 periods EMA upside as a sign of a bullish movement. The price continues its trading above the two EMAs. The Stochastic Oscillator period 14 is above 75 levels and the signal lines pointing downside to indicate sell signal which may be a pullback.
Please note: insidebitcoins.com is not a financial advisor. Do your own research before investing your funds in any financial asset or presented product or event. We are not responsible for your investing results.
Read more:
- Bitcoin Price Prediction: Bitcoin (BTC) Breaches $10,000 Resistance, Builds Strength on Market Surge
- XRP Slides Further Below, As Ripple Face Another Lawsuit
Join Our Telegram channel to stay up to date on breaking news coverage