Join Our Telegram channel to stay up to date on breaking news coverage
XRP Spirals Points – September 24
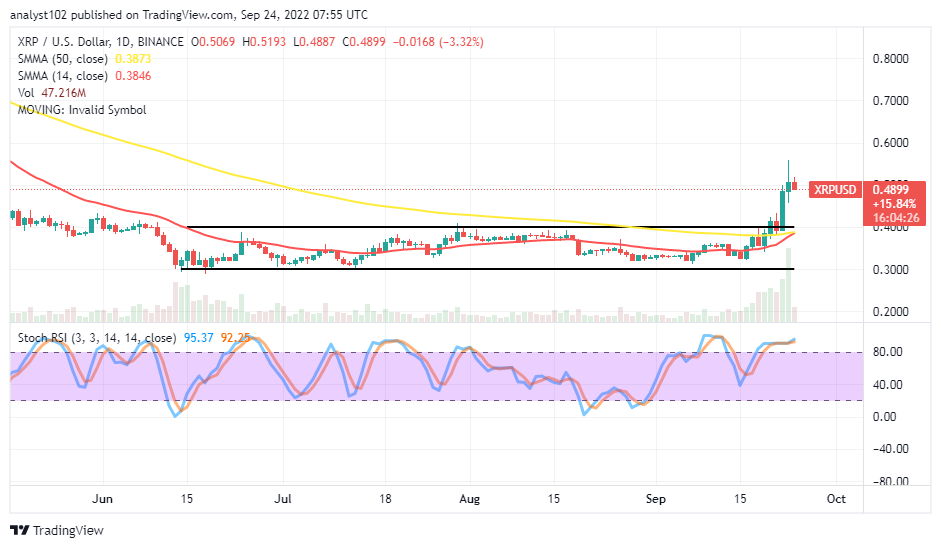
After a long and overdue range-bound trading mode, the Ripple XRP/USD market spirals points out of the trading spots to the moon direction. The crypto economy features within $0.3159 and $0.5523 trading lines over the last thirty days. As of writing, the price trades around $0.4899 at an average percentage rate of 3.32 negatives.
XRP Price Statistics:
XRP price now – $$0.4899
XRP market cap – $24.4 billion
XRP circulating supply – 49.85 billion
XRP total supply – 100 billion
Coinmarketcap ranking – #6
XRP Spirals Points
Key Levels:
Resistance levels: $0.60, $0.65, $0.70
Support levels: $0.35, $0.30, $0.25 XRP/USD – Daily Chart
The Ripple XRP/USD daily chart depicts the crypto market spirals points, breaking northwardly out of the range-bound spots of $0.30 and $0.40. Recently, the sudden upward motion came to be during the 22nd trading session against the barriers built around the upper range line to average a higher resistance point beneath the $0.60 resistance level. The 50-day SMA indicator is closely below the upper range line drawn at $0.40 as the 14-day SMA indicator also bent northwardly to touch the bigger trading tool from underneath. The Stochastic Oscillators in the overbought region, moving in 92.25 and 95.37 range values.
Your capital is at risk.
Are there signs that can lead the Ripple XRP/USD market back into its range-bound zones?
It may not be an assumption that will materialize in the near time regarding seeing the Ripple XRP/USD market declining downward into its recent range-bound zones of $0.40 and $0.30 as the crypto’s price spirals points to the north side. In a bid for a continual longing movement process, reversals on a light note should not overlook. And, a smaller time frame, especially a 1-hour chart, will be instrumental in deciding when an upward running will take effect.
On the downside of the technical analysis, the Ripple XRP/USD trade bears need to be alert when there is a rejection around high-trading resistance lines around the $0.50 and $0.60 resistance lines to consider the execution of a sell order. If the market holds less-active motion around the former value line can lead to an occurrence of other rounds of ranging outlook between it and the $0.40 line afterward.
XRP/BTC Price Analysis
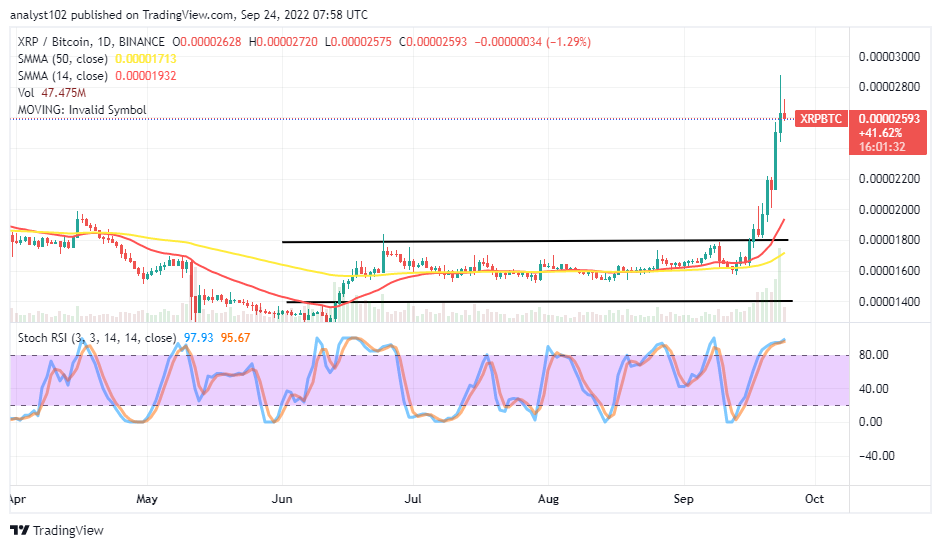
Ripple XRP has significantly shot up out of its range-bound spots against Bitcoin. The cryptocurrency pair price spirals points as variant bullish candlesticks have formed in a row to create a straight path line over the upper range line. The 14-day SMA trend line has crossed northward, breaking past the upper horizontal line that marks the logical higher zone of resistance. The Stochastic Oscillators have tightened up as they point to the north side at 95.67 and 97.93 range values. It shows the base crypto may get retraced in the near time against the counter-trading crypto.
Read more:
Join Our Telegram channel to stay up to date on breaking news coverage

