Join Our Telegram channel to stay up to date on breaking news coverage
The Universal Market Access price prediction begins to move to the upside as the coin spikes to touch the daily high at $3.04.
Universal Market Access Prediction Statistics Data:
- Universal Market Access price now – $2.46
- Universal Market Access market cap – $160.4 billion
- Universal Market Access circulating supply – 68.9 million
- Universal Market Access total supply – 108.8 million
- Universal Market Access Coinmarketcap ranking – #183
UMA/USD Market
Key Levels:
Resistance levels: $3.4, $3.6, $3.8
Support levels: $1.8, $1.6, $1.4
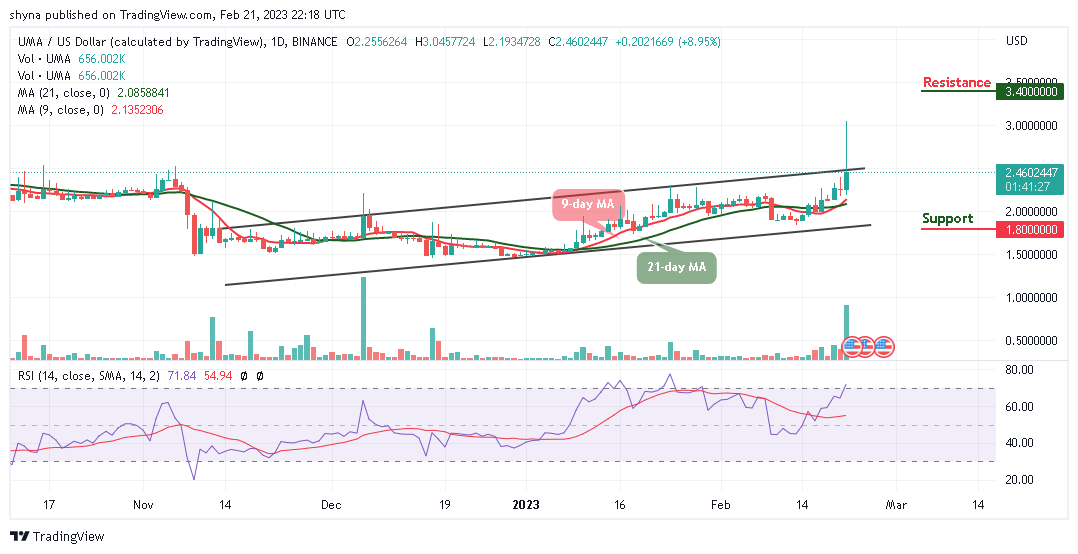
UMA/USD is seen crossing above the upper boundary of the channel as the coin moves to touch the daily high of $3.04. However, for the past couple of days, the coin has been trading steadily above the 9-day and 21-day moving averages and the market may experience more bullish movements if the bulls increase the buying pressure.
Universal Market Access Price Prediction: UMA/USD May Retain the Upside
The Universal Market Access price may continue to stay above the 9-day and 21-day moving averages for it to reclaim the resistance level of $3.0. Therefore, if the bulls defend the $2.5 level, the coin may continue its upward movement by moving toward the upper boundary of the channel. However, any further bullish movement may hit the potential resistance levels of $3.4, $3.6, and $3.8.
Nevertheless, this prediction may not be right if the bears return to the market and break below the lower boundary of the channel, and the Universal Market Access could touch the low of $1.8, $1.6, and $1.4 support levels. Moreover, the technical indicator Relative Strength Index (14) is likely to cross into the overbought region; suggesting that more bullish movements are likely to play out.
Against Bitcoin, the Universal Market Access price is trying to move up higher as it is likely to cross above the upper boundary of the channel with a major resistance level at 1250 SAT. The long-term moving averages may likely keep the bullish movement as the market is starting a new trend by crossing above the upper boundary channel.
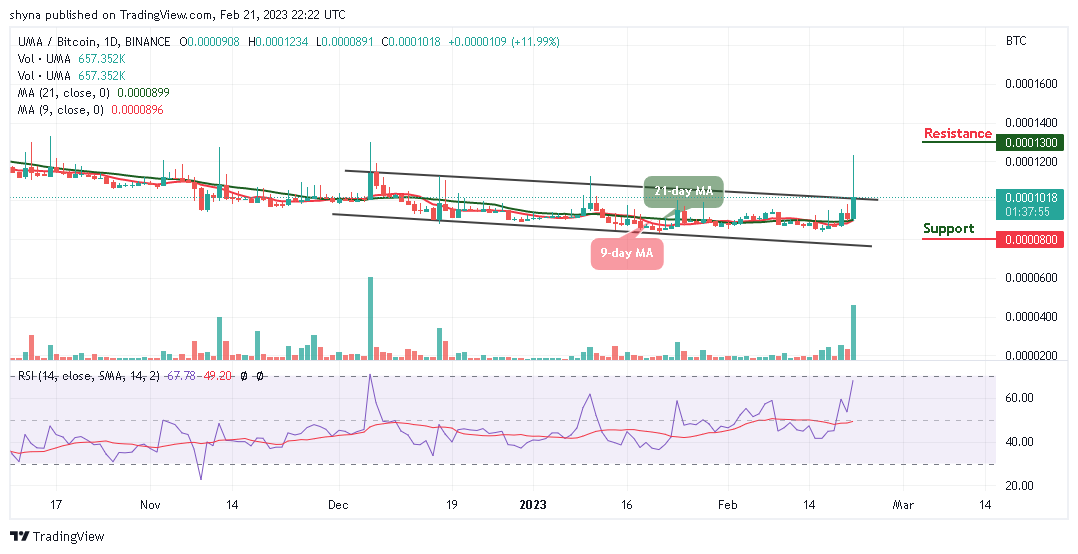
From above, if the buyers could keep the price above moving averages, higher resistance could be located at 1300 SAT and above. Moreover, should the bulls fail to move above the levels then, the coin may head towards the lower boundary of the channel to hit the support level of 800 SAT and below while the technical indicator Relative Strength Index (14) is moving into the overbought region, showing that buyers are coming to play out.
Universal Market Access Alternatives
After rising above the channel, the Universal Market Access price retreats as a result of selling pressure in the market. The sellers are likely to gain control of the market, but if the UMA price can break significantly above the $3.0 level, the bulls could resume back into the market. On that note, the Fight Out (FGHT) token is doing great in the market and the presale is still on as it has raised close to $5m in the presale. Therefore, investors are able to earn up to 75% in additional bonus tokens during the presale, depending on the purchase amount and vesting period chosen.
Join Our Telegram channel to stay up to date on breaking news coverage