Join Our Telegram channel to stay up to date on breaking news coverage
The Universal Market Access price prediction shows that UMA moves higher and crosses above the moving averages to stay higher.
UMA Price Prediction Statistics Data:
- Universal Market Access price now – $1.60
- Universal Market Access market cap – $110.8 million
- Universal Market Access circulating supply – 68.9 million
- Universal Market Access total supply – 108.8 billion
- Universal Market Access Coinmarketcap ranking – #159
UMA/USD Market
Key Levels:
Resistance levels: $2.20, $2.40, $2.60
Support levels: $1.10, $0.90, $0.70
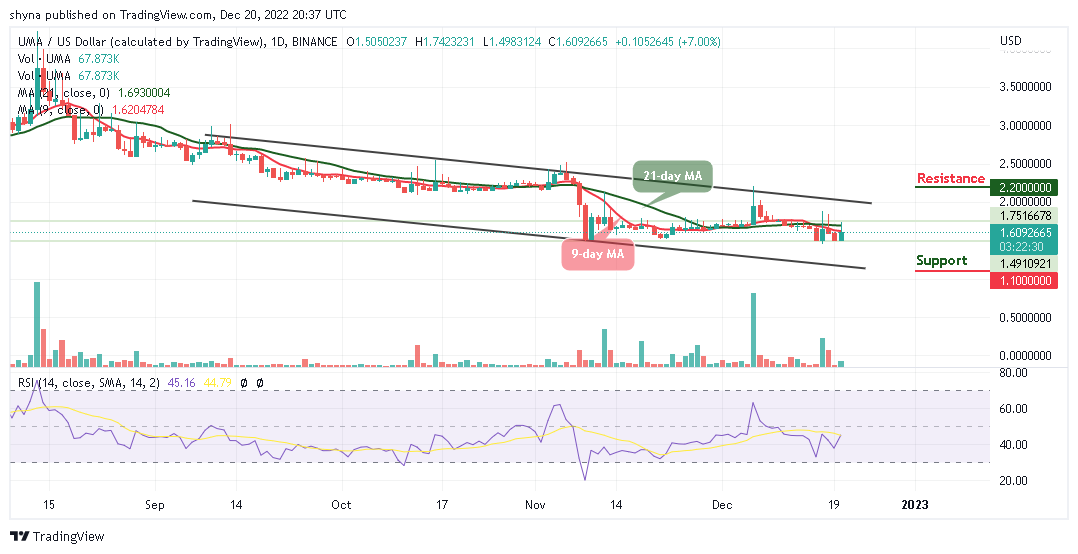
UMA/USD keeps the bullish movement as the coin breaks higher today. Currently, Universal Market Access is making a gain of almost 7.00% and touches the daily high of $1.74. However, the crypto needs to keep its price above the 9-day and 21-day moving averages. Meanwhile, traders can expect Universal Market Access to prepare itself steadily for a ride toward $2.0.
Universal Market Access Price Prediction: Would UMA Move to the Upside?
In the last few days, the Universal Market Access price has been fluctuating within the channel but today, the coin moves toward the upper boundary of the channel. However, the ongoing trend may move a little bit higher in the coming week if the 9-day moving average crosses above the 21-day moving average, and the coin may reach the nearest resistance at $1.80, therefore, any further bullish movement could hit additional resistance levels at $2.20, $2.40, and $2.60 respectively.
Nevertheless, a bearish drop towards the lower boundary of the channel could roll the market back to the downside and the initial support level of $2600. Meanwhile, the support levels could be located at $2500, $2300, and $2100. As the trading volume increases, the technical indicator Relative Strength Index (14) moves above 40-level which indicates that more bullish signals may come to play.
When compares with Bitcoin, UMA trades above the 9-day and 21-day moving averages. The price is changing hands at 951 SAT as the technical indicator Relative Strength Index (14) moves toward the 50-level. However, the daily chart reveals that the coin is retreating after touching the daily high of 1035 SAT.
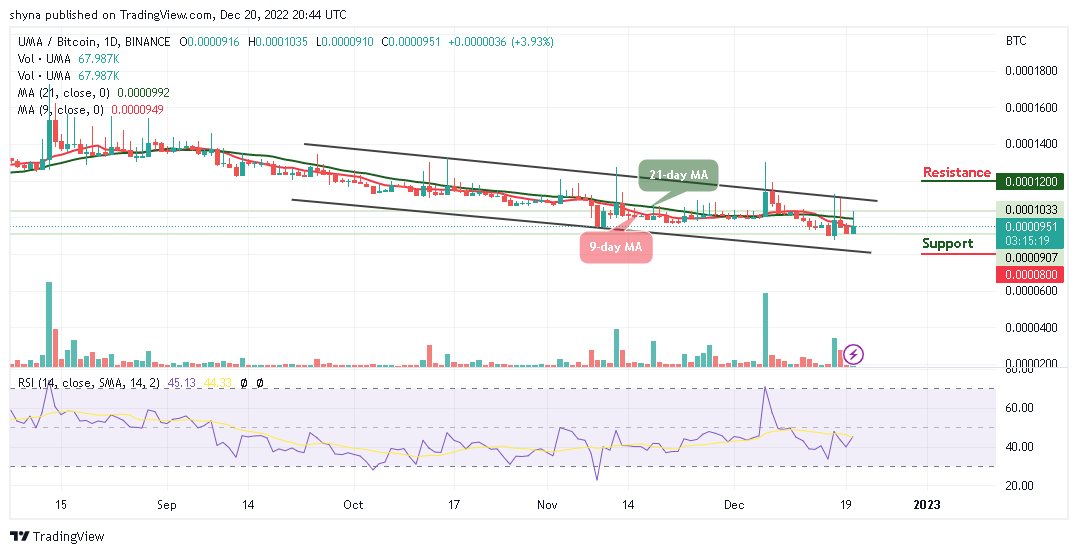
On the contrary, the critical support level could be located at 800 SAT and below while a higher sustainable move may likely attract new buyers to the market with the next resistance at 1200 SAT and above.
Join Our Telegram channel to stay up to date on breaking news coverage