Join Our Telegram channel to stay up to date on breaking news coverage
The Graph Price Prediction – June 5
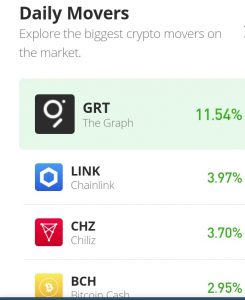
The market operation involving The graph and the US Dollar has it on the record that the crypto economy has been trending downwards at a low rate over several sessions. The market’s all-time high is $2.88 as there is no data for its all-time low presently on the coinmarketcap.com site. Price keeps a negative 4.53% to trade around the $0.15 line.
The Graph (GRT) Price Statistics:
GRT price now – $0.1573
GRT market cap – $1.1 billion
GRT circulating supply – 6.9 billion
GRT total supply – 10 billion
Coinmarketcap ranking – #52
The Graph (GRT) Market
Key Levels:
Resistance levels: $0.30, $0.40, $0.50
Support levels: $0.10, $0.075, $0.05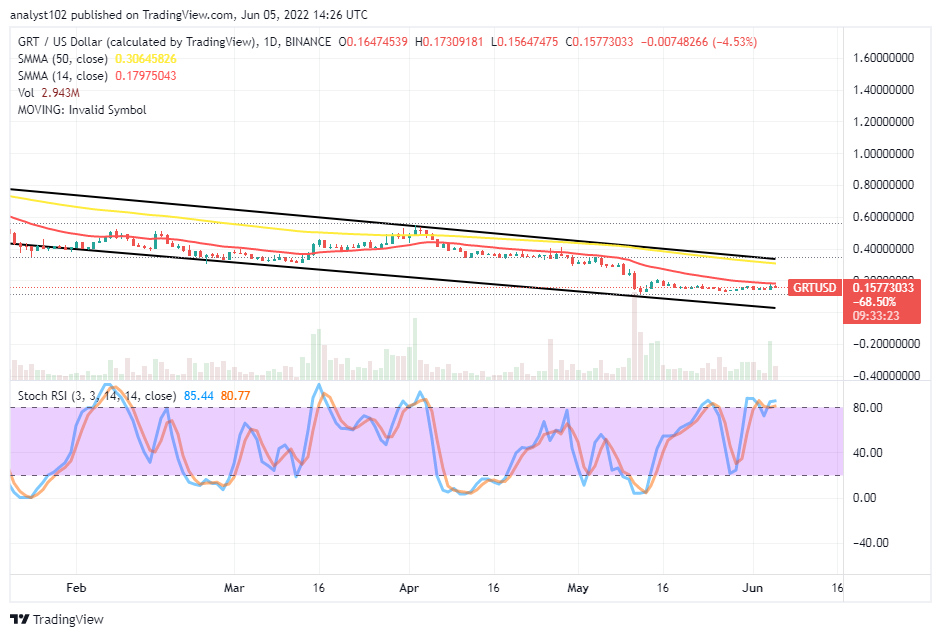 GRT/USD – Daily Chart
The GRT/USD daily chart shows the crypto-economic market has been trending downwards at a low rate over a long session. The bearish channel trend lines are drawn, helping to ascertain the path price is running to the downside around the trading indicators. The 14-day SMA trend line is underneath the 50-day SMA trend line. And they are pointing in the south direction. The Stochastic Oscillators are around the 80 range, denoting a start of consolidation-moving mode.
Will the GRT/USD market continue trending downwards through lower support points?
The GRT/USD market’s gravitational force as of the present shows a signal to back a lowering force that can see the price trending downwards to a lower support line around the $0.10 in the subsequent volatile trading operations. The presumption analytics may not be happening in the near time as some range-trading traits will still have to play out based on the less-active moving mode the market is currently witnessing from bulls and bears.
On the downside of the technical analysis, the falling force has been around the trend line of the 14-day SMA indicator. And the present outlook suggests a probability of witnessing another round of bearish-trending motion if the GRT/USD market bulls remain weakened to garner momentum from its $0.15 current trading point afterward. At this point, it appears the weight of the pressure to the downside won’t be producing a heavy move to the advantage of sellers on a quick mote.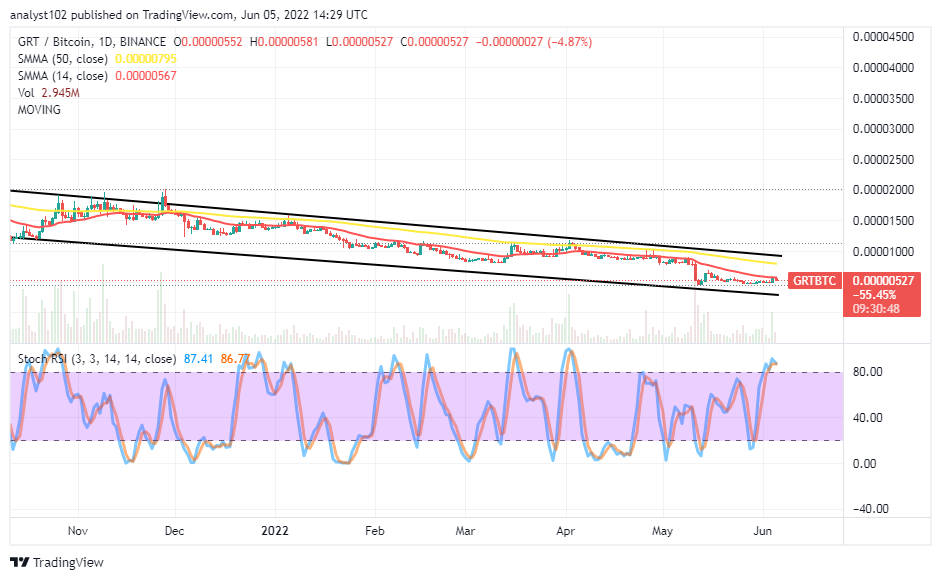
GRT/BTC Price Analysis
The Graph (GRT) market’s pushing force against Bitcoin (BTC) has been caged in bearish channel trend lines over a couple of sessions. The cryptocurrency pair market has been trending downwards at a low rate around the trend lines of the SMAs. The 14-day SMA indicator is below the 50-day SMA indicator. The Stochastic Oscillators are in the overbought region. That signifies the base crypto may still be taking time to regain its lost stance against the counter-trading crypto for a while.
Read more:
Join Our Telegram channel to stay up to date on breaking news coverage