Join Our Telegram channel to stay up to date on breaking news coverage
XLM Price Analysis – August 23
Today, it seems that the price of XLM could drop by the end of the day. Anyway, Stellar is trading with the bearish nature.
XLM/USD Market
Key Levels:
Resistance levels: $0.078, $0.80, $0.082
Support levels: $0.054, $0.052, $0.050
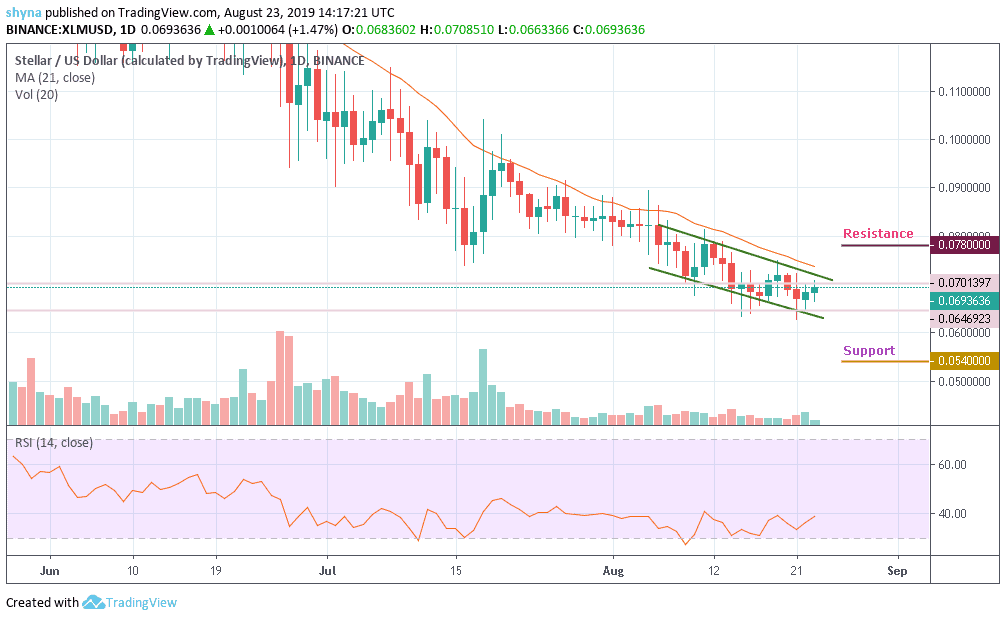
Yesterday, the XLM price trades around $0.066 again but after rising close to $0.070 at $0.069. The crypto market seems to have a dull day even today as the major coin like Bitcoin, Ethereum and XRP have been trading with a downtrend only. Bitcoin price, the anchor has even slipped below $10,000 and is currently correcting upwards.
However, taking a look at the price chart, we can see the trading volume is still low. So, if the XLM/USD pair continues to stay under the control of bears, the price may roll back to previous supports at $0.054, $0.052 and $0.050 levels. On the upside, the bulls need to break out and push the price towards the next level of resistance at $0.078, $0.080 and $0.082. The RSI (14) is still moving under level 40, meaning that the buyers are coming up.
XLM/BTC Market
Against Bitcoin, the market price still keeps falling down but currently moves in sideways since August 11. As at the time of writing, XLM/BTC is trading at level 666SAT and about to cross the orange-line of 21-day moving average to resume the uptrend. For now, looking at the chart, one can easily say that the market is indecisive as neither the bulls nor the bears are controlling the market.
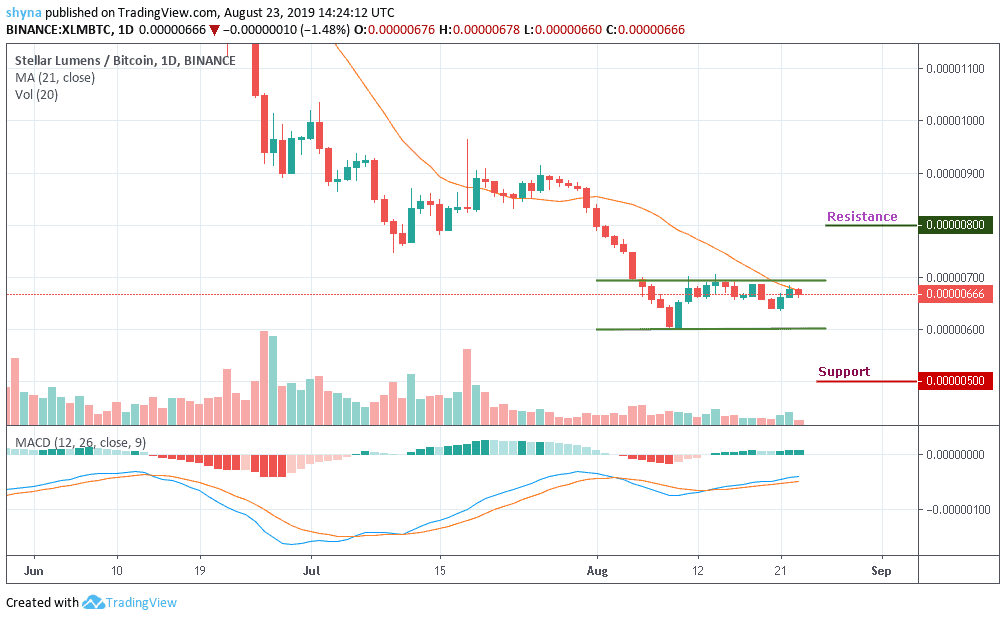
Nevertheless, we can expect a long-term surge in volatility to play out as soon as the market decides the next direction. From above, the nearest resistance to look out for are 800SAT and above while from below, the 500SAT and 400SAT may provide supports for the market, should the price rolls back. The MACD indicator is at the positive side, which gives some bullish signals.
Please note: insidebitcoins.com is not a financial advisor. Do your research before investing your funds in any financial asset or presented product or event. We are not responsible for your investing results.
Join Our Telegram channel to stay up to date on breaking news coverage