Join Our Telegram channel to stay up to date on breaking news coverage
The Solana price prediction shows that SOL gets ready for a short-entry level as the coin heads toward the south.
Solana Prediction Statistics Data:
- Solana price now – $29.70
- Solana market cap – $10.6 billion
- Solana circulating supply – 358.1 million
- Solana total supply – 511.6 million
- Solana Coinmarketcap ranking – #9
SOL/USD Market
Key Levels:
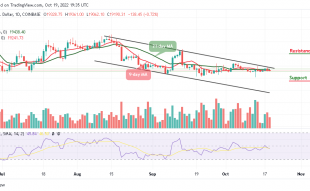
Resistance levels: $38, $40, $42
Support levels: $25, $23, $21
At the time of writing, SOL/USD is seen hovering below the 9-day and 21-day moving averages as the technical indicator Relative Strength Index (14) moves to cross below the 40-level. Meanwhile, a decreasing volume index also suggests a breakdown but more bearish signals are likely to come into the picture if the red line of the 9-day moving average remains below the green line of the 21-day moving average.
Solana Price Prediction: Solana (SOL) Ready to Drop More
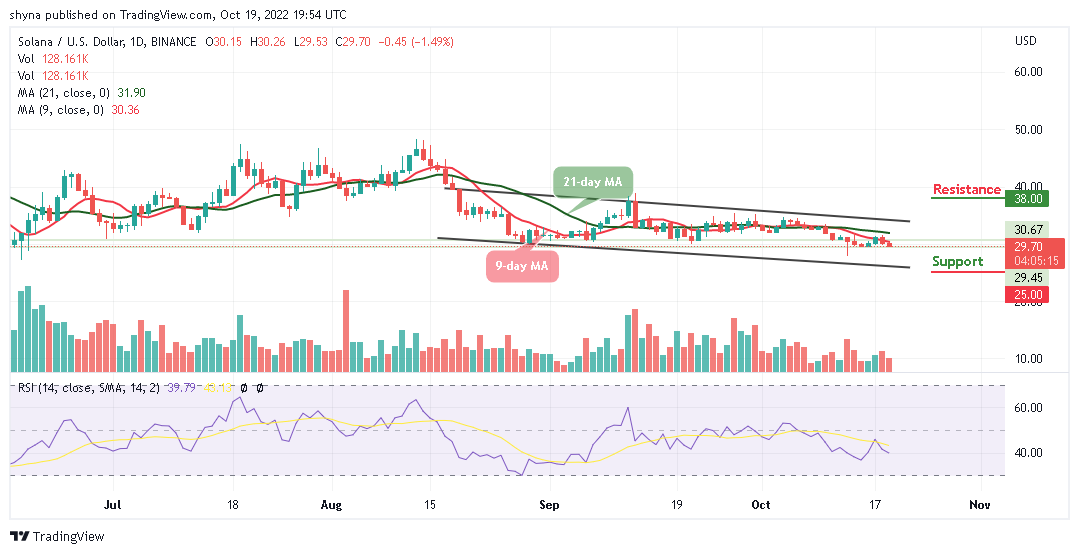
According to the daily chart, as the Solana price moves toward the lower boundary of the channel, the nearest support could be found at $27. However, the Relative Strength Index (14) is also flashing a sell signal aiming to cross below 40-level which may be adding weight to the bearish outlook. Meanwhile, if the 21-day moving average applied to this chart turned into the support area for this coin, then, the declines are unlikely to extend below $29.
Moreover, should in case of the daily bearish candle close below the $29 support, there is a high probability that the price may reach the support levels of $25, $23, and $21. Meanwhile, if the Solana bulls push the price toward the upper boundary of the channel, an increase in buy orders might create enough volume to support gains above $36. Any further bullish movement could reach the resistance levels at $38, $40, and $42 respectively.
Against Bitcoin, traders can see that the Solana performance has been very low due to a bearish recurring. At the time of writing, the coin is hovering below the 9-day and 21-day moving averages. Breaking this barrier could further drag the market to the nearest support levels at 1400 SAT and below as the Relative Strength Index (14) stays below 40-level; a possible selling pressure is likely if it continues to drop.
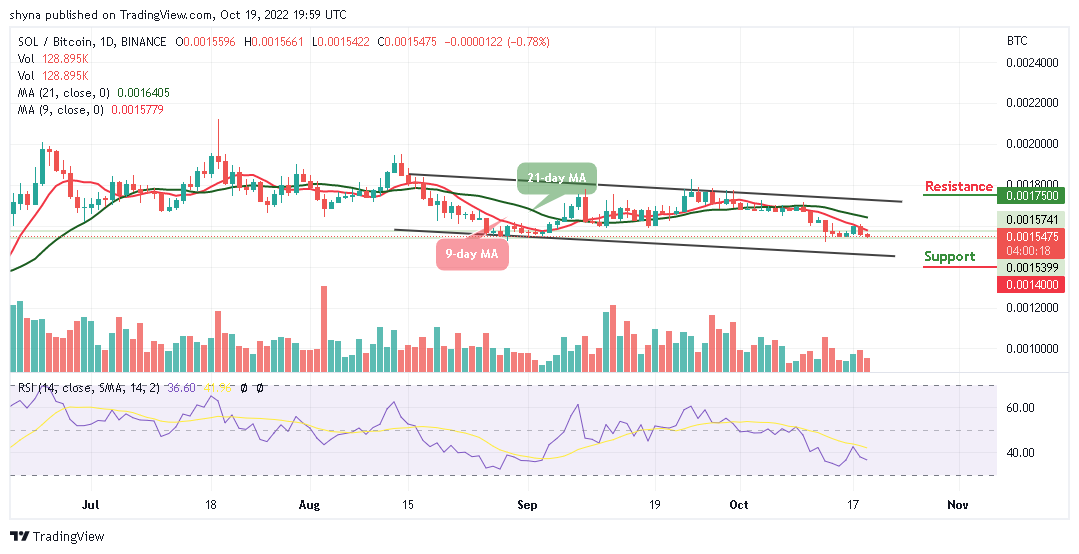
However, SOL/BTC is currently changing hands at 1547 SAT but if the bulls can hold the price tight and push it above the moving averages, the next key resistance could be at 1600 SAT. But, crossing above the upper boundary of the channel might move the coin to the potential resistance at 1750 SAT and above.
One alternative to Bitcoin is the IMPT token, which is on presale now at the link below and has raised $4.5 million so far.
Related:
- How to Buy IMPT Token
- Ripple Price Prediction: XRP/USD Turns Down as It Faces Stiff Resistance at $0.17
- Annual Litecoin Price Prediction: LTC/USD Stands Firm; Price May Shoot Above $200
Join Our Telegram channel to stay up to date on breaking news coverage