
Join Our Telegram channel to stay up to date on breaking news coverage
The Bitcoin price prediction shows that BTC is likely to spread the bearish move after numerous attempts to hold gains above $19,000.
Bitcoin Prediction Statistics Data:
- Bitcoin price now – $19,190
- Bitcoin market cap – $368.1 billion
- Bitcoin circulating supply – 19.1 million
- Bitcoin total supply – 19.1 million
- Bitcoin Coinmarketcap ranking – #1
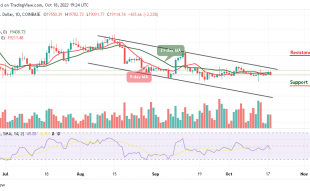
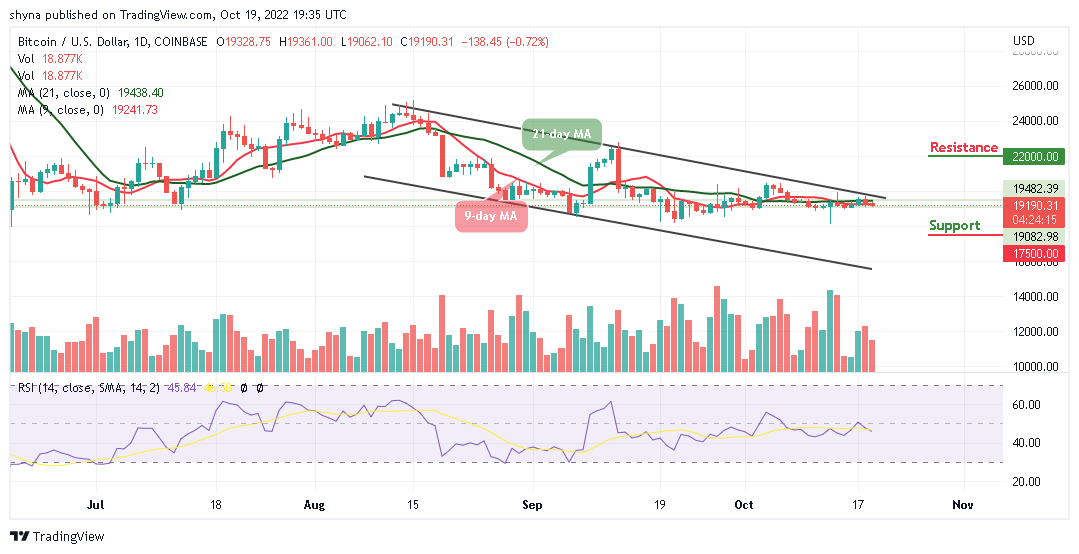
BTC/USD Long-term Trend: Ranging (Daily Chart)
Key levels:
Resistance Levels: $22,000, $23,000, $24,000
Support Levels: $17,500, $16,500, $15,500
For the past few days, BTC/USD has been battling with $19,000 as the largest cryptocurrency trades below the 9-day and 21-day moving averages after failing to cross above the upper boundary of the channel. Hence, the bearish control has been seen across the market, with other major digital assets seeing similar losses when trading below the moving averages.
Bitcoin Price Prediction: Can BTC Price Go Lower?
The Bitcoin price is trading at $19,190 with an intraday loss of 0.72% as the prevailing trend is likely to follow the bearish movement. However, Bitcoin (BTC) is currently consolidating within the channel and a breakout of this pattern in the direction of the previous trend is expected to continue. In the meantime, the Bitcoin price is expected to fall and stay below the 9-day and 21-day moving averages which could hit the critical support levels at $17,500, $16,500, and $15,500.
However, if the Bitcoin price crosses above the channel; the price could rise to $20,000 vital resistance while a further bullish drive could take the coin to the resistance levels of $22,000, $23,000, and $24,000 respectively. Moreover, the technical indicator Relative Strength Index (14) is currently moving below the 50-level, which shows a possible bearish momentum may play out or the coin may range-bound before moving higher.
BTC/USD Medium-term Trend: Ranging (4H Chart)
As the market opens today, the Bitcoin price touches the daily low of $19,093, but now hovering around $19,200. Should the price drop further below the 9-day and 21-day moving averages, it could hit the next level of support at $18,500 and below.
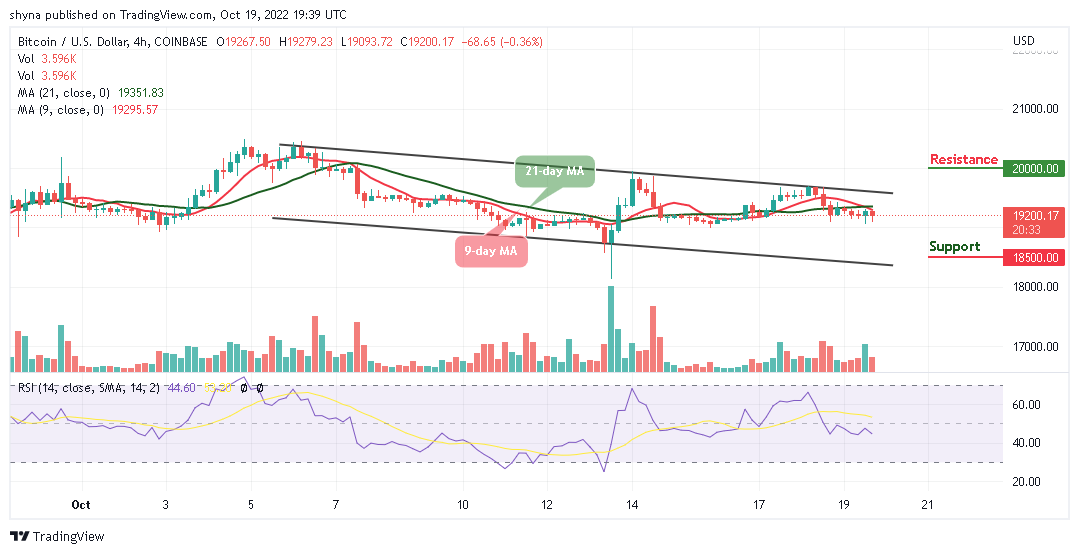
However, should the bulls push the coin above the upper boundary of the channel, the Bitcoin price could hit the potential resistance level of $20,000 and above. For now, the market may begin to experience a downtrend as the technical indicator Relative Strength Index (14) remains below the 50-level.
One alternative to Bitcoin is the IMPT token, which is on presale now at the link below and has raised $4.5 million so far.
Related:
- How to Buy IMPT Token
Join Our Telegram channel to stay up to date on breaking news coverage