
Join Our Telegram channel to stay up to date on breaking news coverage
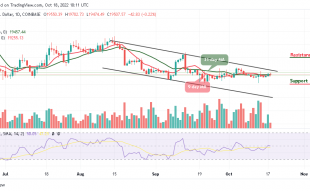
The Bitcoin price prediction shows that BTC keeps trading below the 9-day moving average as the coin touches $19,091 support.
Bitcoin Prediction Statistics Data:
- Bitcoin price now – $19,114
- Bitcoin market cap – $367.3 billion
- Bitcoin circulating supply – 19.1 million
- Bitcoin total supply – 19.1 million
- Bitcoin Coinmarketcap ranking – #1
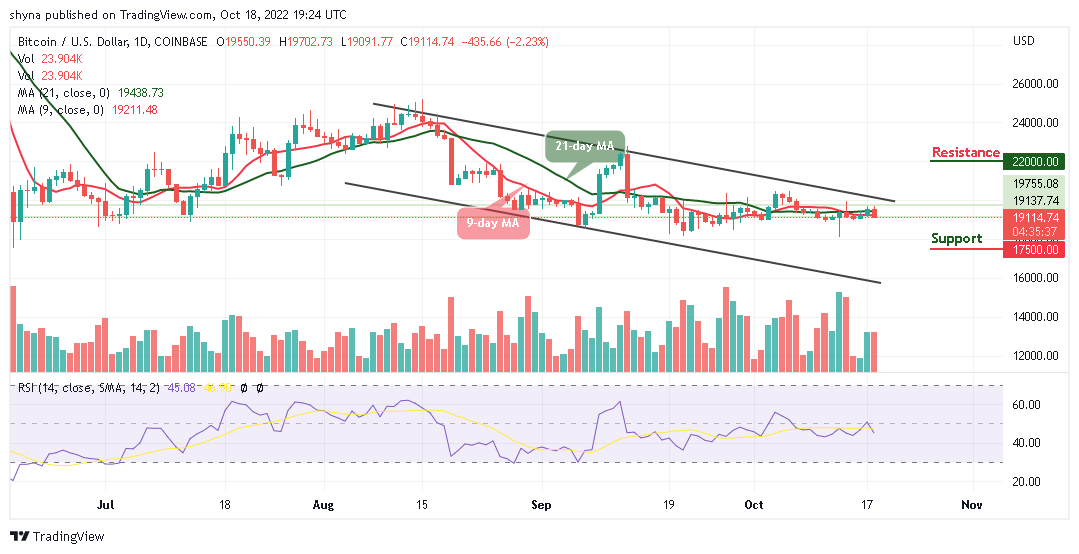
BTC/USD Long-term Trend: Ranging (Daily Chart)
Key levels:
Resistance Levels: $22,000, $23,000, $24,000
Support Levels: $17,500, $16,500, $15,500
BTC/USD is facing a setback as the king coin heads to the downside. The Bitcoin price is likely to have a bearish run in the short term as the technical indicators confirmed. Currently, Bitcoin (BTC) is trading around the $19,114 level after a free fall from $19,702 during the European session today.
Bitcoin Price Prediction: Bitcoin (BTC) May Head to the Downside
Looking at the daily chart, the Bitcoin price is currently nose-diving below the 9-day day and 21-day moving averages. However, if the price slumps below the support level of $18,000, the king coin is likely to gain more downtrends, further bearish movement could locate the supports at $17,500, $16,500, and $15,500, making room for BTC to fall even further.
In the meantime, the technical indicator Relative Strength Index (14) is moving below the 50-level as the trading volume could be in support of the bears. Moreover, if the bulls decide to push the price back above the moving averages, BTC/USD may likely cross above the upper boundary of the channel to locate the resistance levels at $22,000, $23,000, and 24,000 respectively.
BTC/USD Medium-term Trend: Ranging (4H Chart)
On the 4-Hour chart, the Bitcoin price slumps below the 9-day and 21-day moving averages, because of this falling, the nearest support level could be found at the $18,800 level. However, the price may likely fall below the lower boundary of the channel if the bears stepped back into the market.
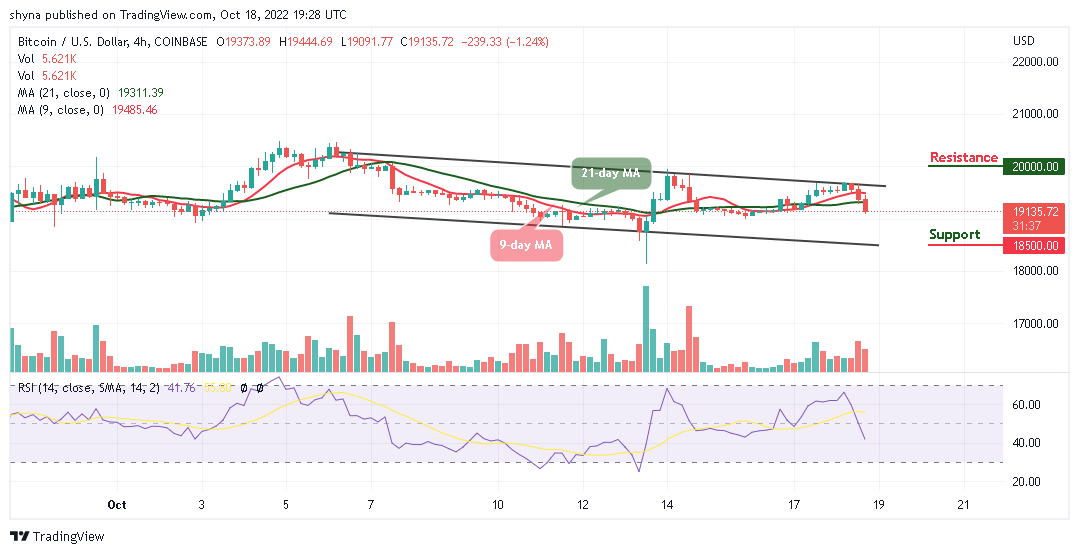
Nonetheless, a further bearish movement could test the critical support at the $18,500 level and below, while the resistance could be located above the upper boundary of the channel to hit the resistance level of $20,000 and above. Meanwhile, the Bitcoin price is currently moving into the negative side as the technical indicator Relative Strength Index (14) moves to cross below the 40-level.
Related:
- How to Buy IMPT Token
Join Our Telegram channel to stay up to date on breaking news coverage