Join Our Telegram channel to stay up to date on breaking news coverage
The Bitcoin price prediction shows that BTC rises in the early hours of today, but got rejected as the market ranges.
Bitcoin Prediction Statistics Data:
- Bitcoin price now – $19,507
- Bitcoin market cap – $374.4 billion
- Bitcoin circulating supply – 19.1 million
- Bitcoin total supply – 19.1 million
- Bitcoin Coinmarketcap ranking – #1
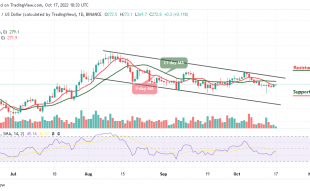
BTC/USD Long-term Trend: Ranging (Daily Chart)
Key levels:
Resistance Levels: $22,000, $23,000, $24,000
Support Levels: $18,000, $17,000, $16,000
BTC/USD may begin to follow the bearish movement if the bears force the king coin to bow down to fresh losses. At the time of writing, the Bitcoin price is changing hands at $19,507 after adjusting from the resistance level of $20,000 which is an intraday high. Moreover, the Bitcoin price may be vulnerable to losses if the price crosses below the moving averages.
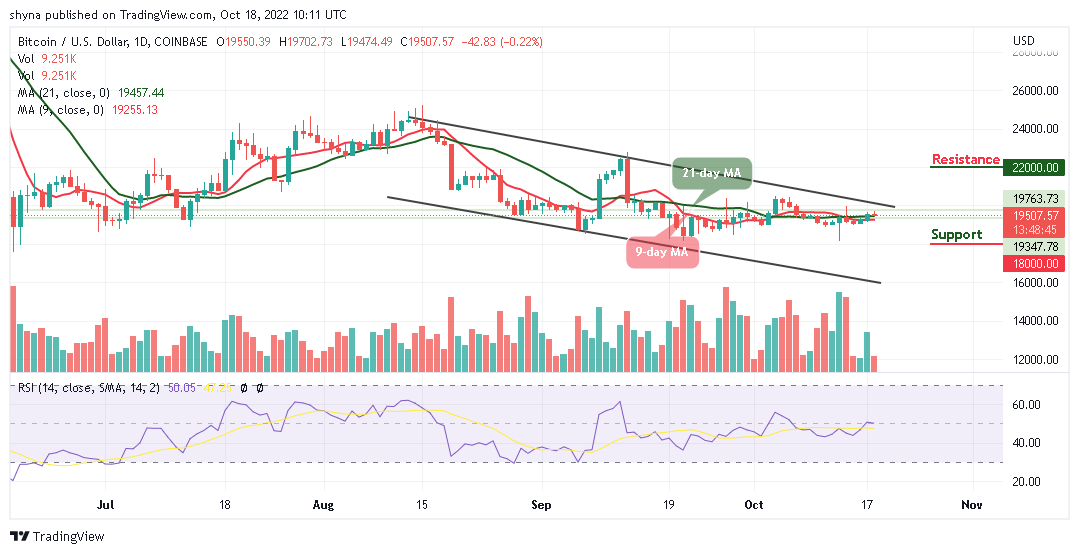
Bitcoin Price Prediction: Bitcoin (BTC) Bears May Show Again
The Bitcoin price from a technical angle reveals that the market price may follow the downtrend or continue to move sideways because the bullish movement is not visible now. However, the technical indicator Relative Strength Index (14) may confirm the bearish movement if the signal line drops below the 50-level.
Moreover, bulls are currently banking on the 9-day moving average to ensure that despite a reversal, the Bitcoin price stays above this barrier. Any bearish movement below this could draw the coin towards the lower boundary of the channel and may cause the coin to reach the critical supports at $18,000, $17,000, and $16,000. Following the upward movement, if the coin crosses above the upper boundary of the channel, it may hit the nearest resistance levels at $22,000, $23,000, and $24,000 respectively.
BTC/USD Medium-term Trend: Ranging (4H Chart)
As the 4-hour chart reveals, the Bitcoin price is likely to cross below the 9-day and 21-day moving averages, and the bears may come back into the market while the bulls are trying to defend the support level of $19,000 and below.
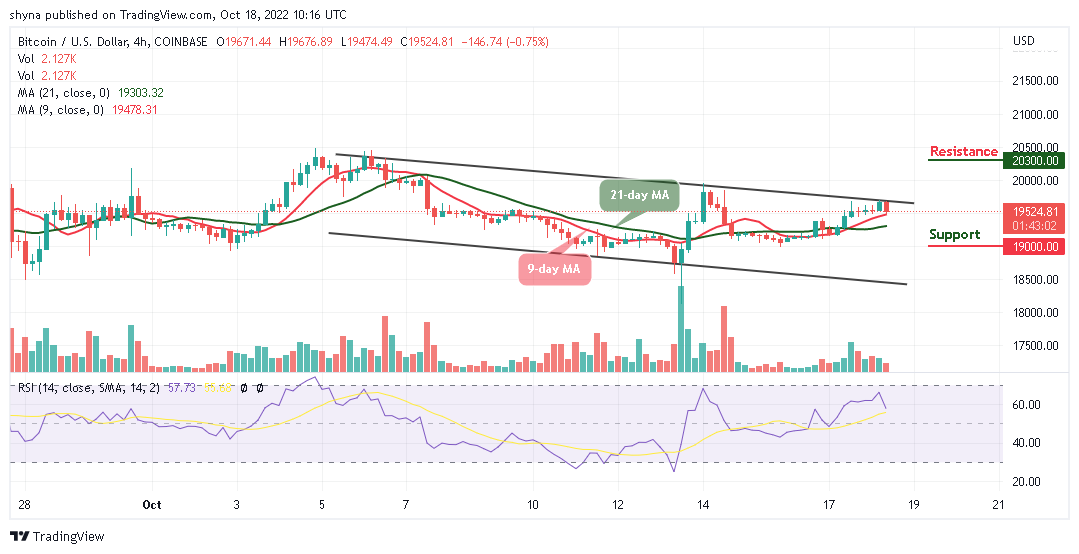
Moreover, buyers may need to regroup and make sure that the king coin does not cross below the daily low of $19,474, once this is done, traders may expect a bullish cross above the upper boundary of the channel, and this could push the king coin to the resistance level of $20,300 and above. Meanwhile, the technical indicator Relative Strength Index (14) is seen nose-diving below the 60-level, suggesting a bearish movement.
One alternative to Bitcoin is the IMPT token, which is on presale now at the link below and has raised $4.5 million so far.
Related:
- How to Buy IMPT Token
Join Our Telegram channel to stay up to date on breaking news coverage