
Join Our Telegram channel to stay up to date on breaking news coverage
The Solana price prediction shows that SOL is recording another downtrend of 4.65%, in the last 24 hours as the coin declines heavily.
Solana Prediction Statistics Data:
- Solana price now – $29.71
- Solana market cap – $10.6 billion
- Solana circulating supply – 357.8 million
- Solana total supply – 511.6 million
- Solana Coinmarketcap ranking – #9
SOL/USD Market
Key Levels:
Resistance levels: $40, $42, $44
Support levels: $22, $20, $18
Your capital is at risk
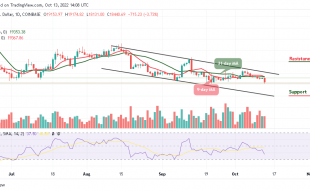
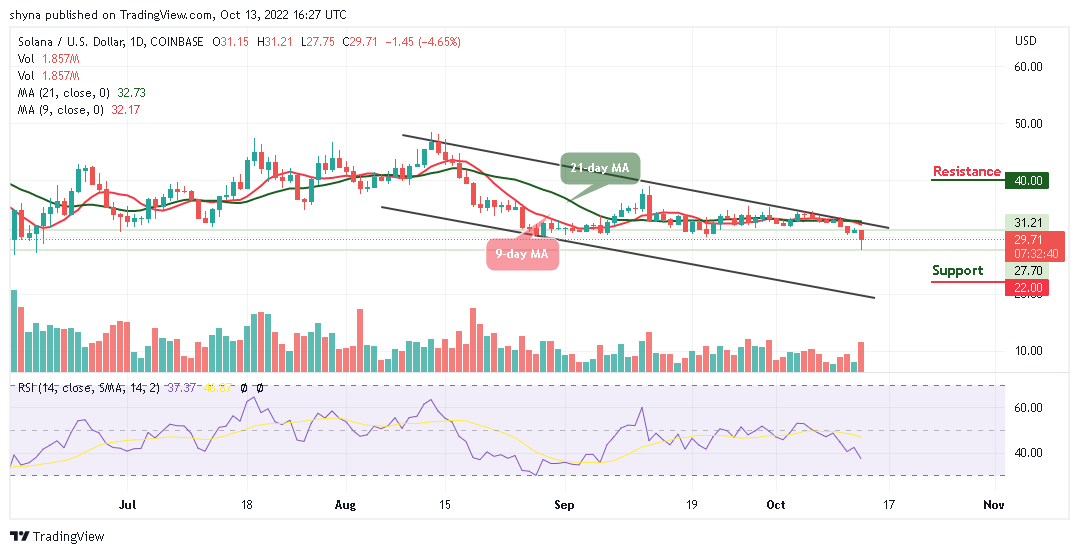
SOL/USD is currently following the downward movement as the coin drops to a $27.75 low today. The Solana price is sliding below the 9-day and 21-day moving averages, aiming to head toward the lower boundary of the channel. The technical indicator Relative Strength Index (14) indicates increasing bearish momentum as the signal line crosses below the 40-level, indicating that the market sentiment may continue to be bearish.
Solana Price Prediction: Solana May Create More Downtrends
As the daily chart reveals, the Solana price keeps changing below the 9-day and 21-day moving averages where it faces down. However, if the Solana price rises and break above the 9-day and 21-day moving averages, the coin may begin a new upward movement to retest its previous high.
However, the nearest resistance levels might be located around $40, $42, and $44 while the support levels could be found at $22, $20, and $18 respectively giving a low trading volume.
When compares with Bitcoin, the Solana price continues to drop below the 9-day and 21-day moving averages. However, if the Solana price faces the negative side, the next support level may surface below the lower boundary of the channel which could locate the further key support level at 1400 SAT and below.
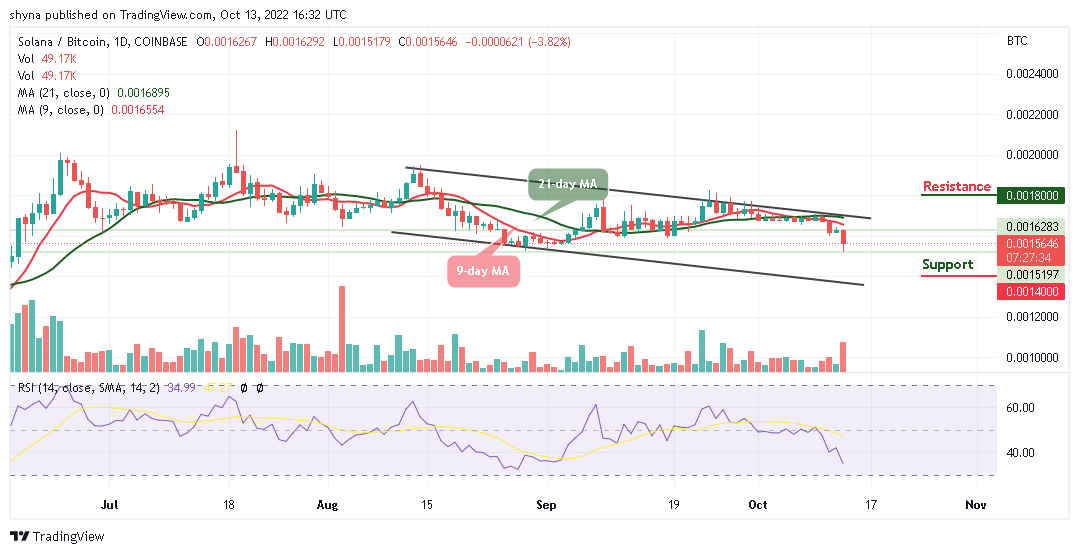
However, on the upside, if the bulls can regroup and crosses above the upper boundary of the channel, the coin could face the 1700 SAT resistance. Any further bullish movement may hit the resistance level at 1800 SAT and above while the technical indicator Relative Strength Index (14) moves below the 40-level and crossing to the downside may bring more bearish pressure into the market.
Join Our Telegram channel to stay up to date on breaking news coverage