Join Our Telegram channel to stay up to date on breaking news coverage
LTC Price Prediction – December 26
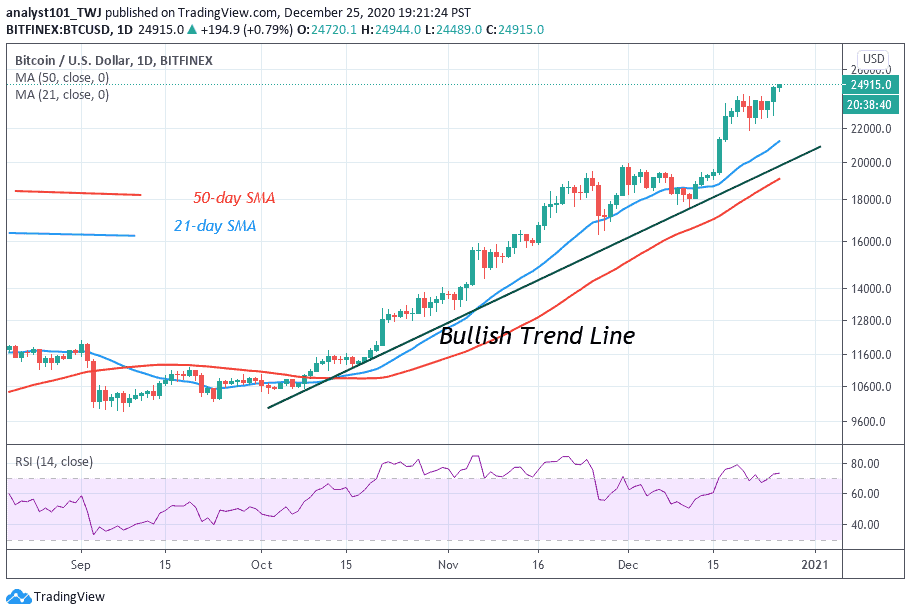
The Litecoin (LTC) price has been increasing at an accelerated rate over the past few weeks and it is currently approaching the $150 resistance level.
LTC/USD Market
Key Levels:
Resistance levels: $180, $200, $220
Support levels: $40, $35, $30
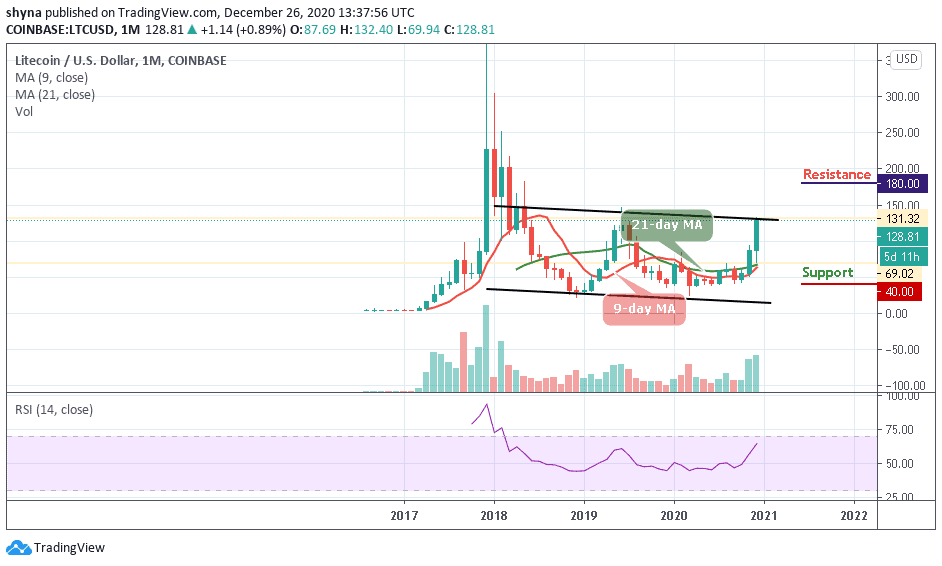
LTC/USD has been able to fetch a decent hike since the beginning of this year and that took the coin from $$41 and now trading at a $132 resistance level. For the past 3months, the coin has been on a path of a bullish trend. Meanwhile, LTC is one of the most emerging coins of the market in the year 2020, and it is likely to reach the $200 level in the coming year 2021 as its next resistance. The long-term outlook is likely to be range-bound.
Where is the LTC Price Going?
As the trading volume keeps increasing, the coin is facing the north as the technical indicator RSI (14) and could touch the resistance levels of $180, $200, and $220 if the bulls make an additional effort. However, in the coming year 2021, if the bulls are to maintain the uptrend; the 9-day MA must cross above the 21-day MA, else the bears could step back into the market and this could cause the coin to hit the nearest support levels at $40, $35, and $30 respectively.
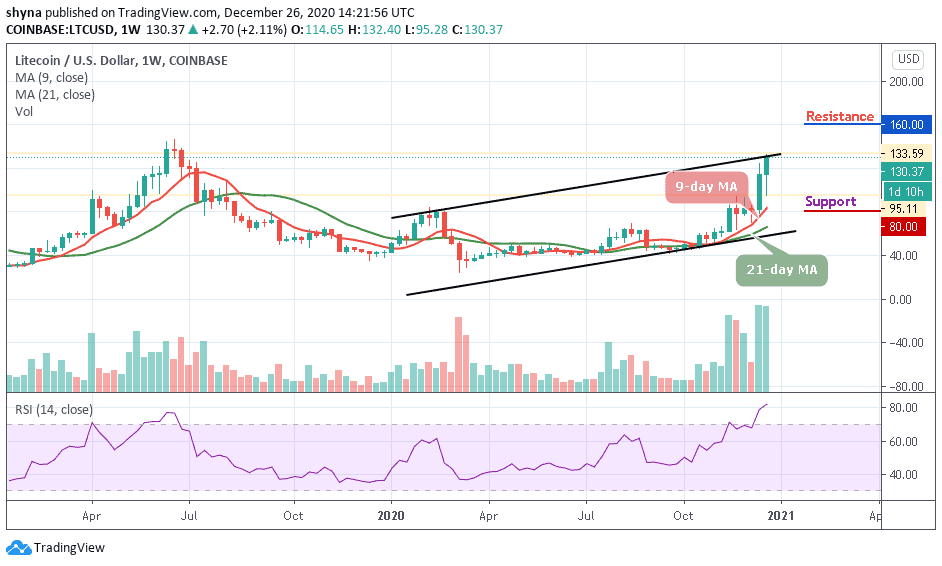
Moreover, the weekly chart also confirms the bullish movement and if the buyers can maintain the current market movement, it is likely for the coin to create higher grounds in the coming year 2021. Although, there may be a little reversal if the RSI (14) is about to leave the overbought region but may be a preparation for the bullish movement.
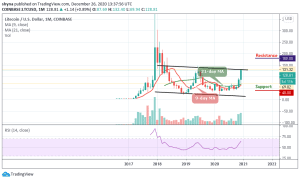
Against Bitcoin, the monthly chart has shown that the bears have been dominating the market with a heavy upsurge as the price moves below the 9-day and 21-day moving averages. Meanwhile, if the bulls can make an attempt to cross above the moving averages and break out of the ascending channel to close the year 2020, LTC/BTC may likely hit the key resistance levels at 0.010000 BTC and above.
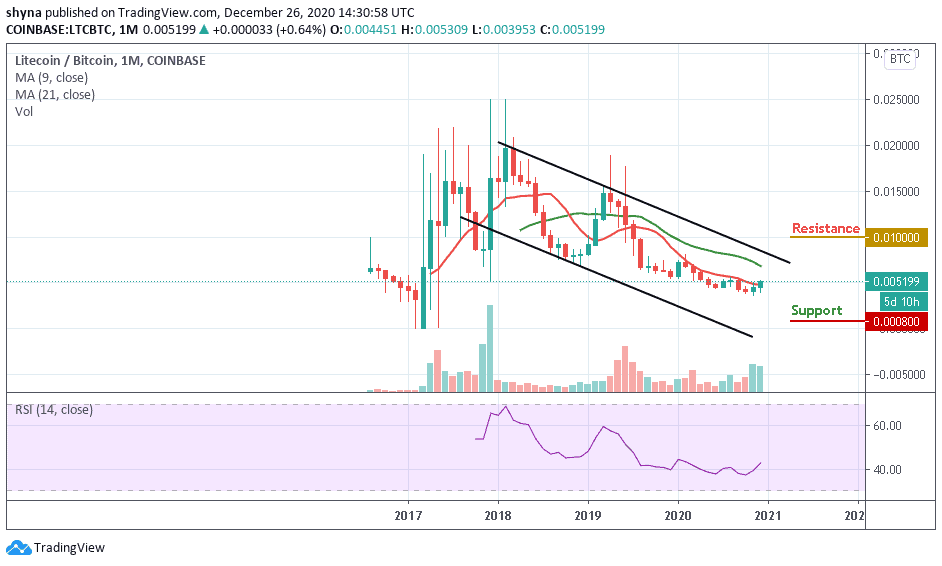
However, as the current value remains below the moving averages, any further bearish movement towards the lower boundary of the channel could locate the critical support at 0.000800 BTC and below. Meanwhile, the RSI (14) is moving above the 40-level, suggesting bullish movement.
Join Our Telegram channel to stay up to date on breaking news coverage