Join Our Telegram channel to stay up to date on breaking news coverage
- Shiba Inu price is up 14% over the last 24 hours and trades with a bullish bias at $0.00004926.
- SHIB’s trading volume and market value have also increased as it holds on to the 11th position by market value.
- Overcoming the $0.000050 resistance level will confirm Shiba Inu’s bullish breakout.
Shiba Inu price is up 14% in the past 24 hours as it trades in the green at 0.0000488. SHIB’s daily trading volume has been increasing in tandem with the price and currently stands at $4,076,044,664, having rallied 7.38% over the past 24 hours. Shiba Inu’s market capitalisation has increased by 13% to $26.88 over the same time frame as SHIB maintained the 11th position, behind rival Dogecoin (DOGE) with respect market value according to data from CoinMarketCap.
All these are bullish signs that indicate the impending SHIB price upswing displayed by the self-claimed ‘Doge killer.”
Shiba Inu Price Bulls To The Rescue
Meme coin sensation SHIB has bounced, along with a host of other top altcoins as the crypto market as announcing the return of the Shiba Inu Buyers. SHIBA has dropped 44% from the October 28 all-time high (ATH) at $0.00008932 to the current price around $0.0000488. This price action has created a descending parallel channel on the 12-hour chart with the Shiba Inu price being severally rejected by the upper boundary of the channel.
Despite showing signs of being recently overbought as shown by the Relative Strength Index (RSI) indicator (see chart below) and still trading within the confines of a descending channel, the price may break out of its bearish channel.
SHIB is facing immediate resistance from the 0.0000500 psychological level embraced by the upper boundary of the channel. Slicing through this resistance level is crucial for Shiba Inu’s bullish breakout.
A decisive bullish breakout will be seen when SHIB overcomes the resistance posed by the 50 Simple Moving Average (SMA) at $0.00005747. After which $0.0000788 embraced by the upper boundary of the falling channel will be next logical move.
Your capital is at risk
SHIB/USD 12-Hour Chart
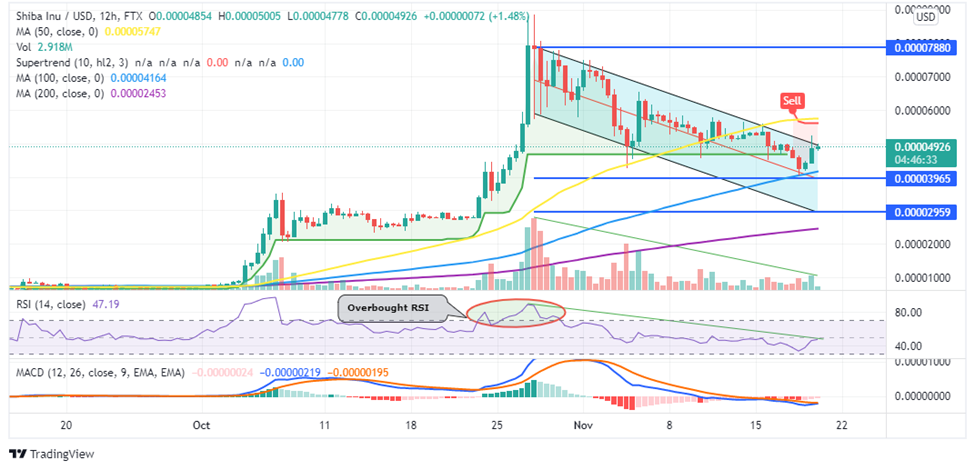
The appearance of three bullish soldiers candlestick pattern and the upward movement of the RSI away from the oversold region adds credence to SHIB’s optimistic outlook.
Moreover, the Moving Average Convergence Divergence (MACD) indictor is about to send a buy Shiba Inu signal as seen in the 12-hour chart. This may occur in the near-tern when the 12-day Exponential Moving Average (EMA) crosses above the 26-day EMA adding credence o SHIB’s bullish outlook.
How Low Can Shiba Inu Price Go?
However, things may go awry for Shiba Inu bulls if they fail to defend the $0.00004862 support level. This will mean a failure to break rise above the descending parallel channel at $0.000050 level suggesting a continuation of the current price action.
In case of such as scenario, the price of the meme coin could drop to tag the $0.00004427 and the middle boundary of the prevailing chart pattern at $0.00003965. If this support level fails to hold, SHIB could drop further reaching the target of the prevailing chart pattern at $0.00002959, a 41% drop from the current price.
The down-sloping moving averages and the decreasing trading volume validate this bearish outlook. In addition, the downward movement of the Relative Strength (RSI) indicator as seen in the 12-hour chart suggests that if the bulls do not come out to strongly beat the bears, the downtrend will continue.
Moreover, the SuperTrend indicator reversed from bullish to bearish on November 18 and moved above the price sending a signal to traders to sell Shiba Inu. Note that as long the SuperTrend indicator remains above the Shiba Inu price, the bearish momentum is set to continue.
Furthermore, data from IntoTheBlock’s In/Out of the Money Around Price (IOMAP) model shows that Shiba Inu price faces significance resistance upwards. The chart shows that the path with the least resistance for Shiba Inu price is downwards, adding credence to the bearish thesis.
SHIBA Inu IOMAP Chart
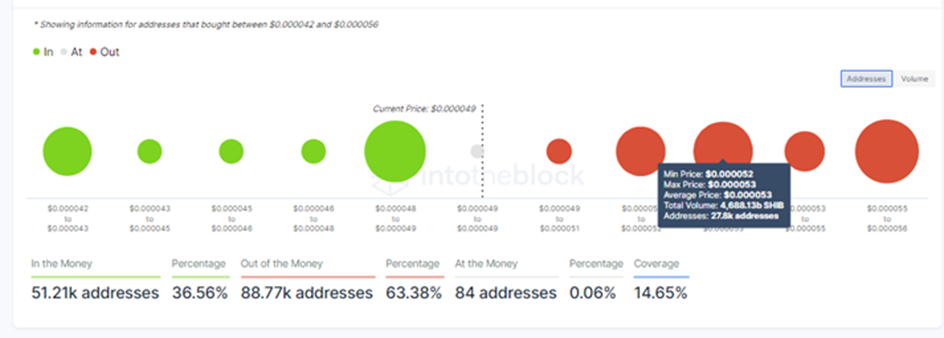
On the flip side, the immediate support around $0.00004862 is within the $0.000048 and $0.000049 price range where 18,970 billion SHIB were previously bought by roughly 30,530 addresses. Compared to the immediate resistance at $0.000050, the immediate support is relatively strong and if the ‘SHIB Army’ can successfully defend this level, the current Shiba Inu price recovery will be sustained.
Where to Buy SHIB
If you are looking for a hassle-free way to buy SHIB, global investment platform eToro is worth a look. Read our guide on the best trading platforms for a review of eToro to find out more about the pioneer on social trading.
There are no trading fees, with the platform making its money in the spread between the bid and ask price. The minimum trade size for crypto assets is $25.
Looking to buy or trade Shiba Inu (SHIB) now? Invest at eToro!
Your capital is at risk
Read more:
- How to buy Ethereum cryptocurrency
- Beginners guide to cryptocurrency
- How to buy Floki Inu cryptocurrency
Join Our Telegram channel to stay up to date on breaking news coverage