Join Our Telegram channel to stay up to date on breaking news coverage
Following a sudden increase in the XRP/USD price, selling activities has started. Consequently, going by signs coming from technical indicators, price action may have resumed a downtrend.
XRP Speculation Statistics Data:
Ripple’s current price: is $0.4449
Ripple’s market cap: $22.1 billion
XRP’s circulating supply: 49.90 billion
XRP’s total supply: 99.99 billion
Ripple Coinmarketcap ranking: #6
Therefore we need to take a critical look at this market and know what action to take. Well, will also examine the XRP/BTC market, using the same technical indicators.
Important Value Marks:
Top Levels: $0.4500, $455, $0.4600
Bottom Levels: $0.4449, $0.4400, $0.4350
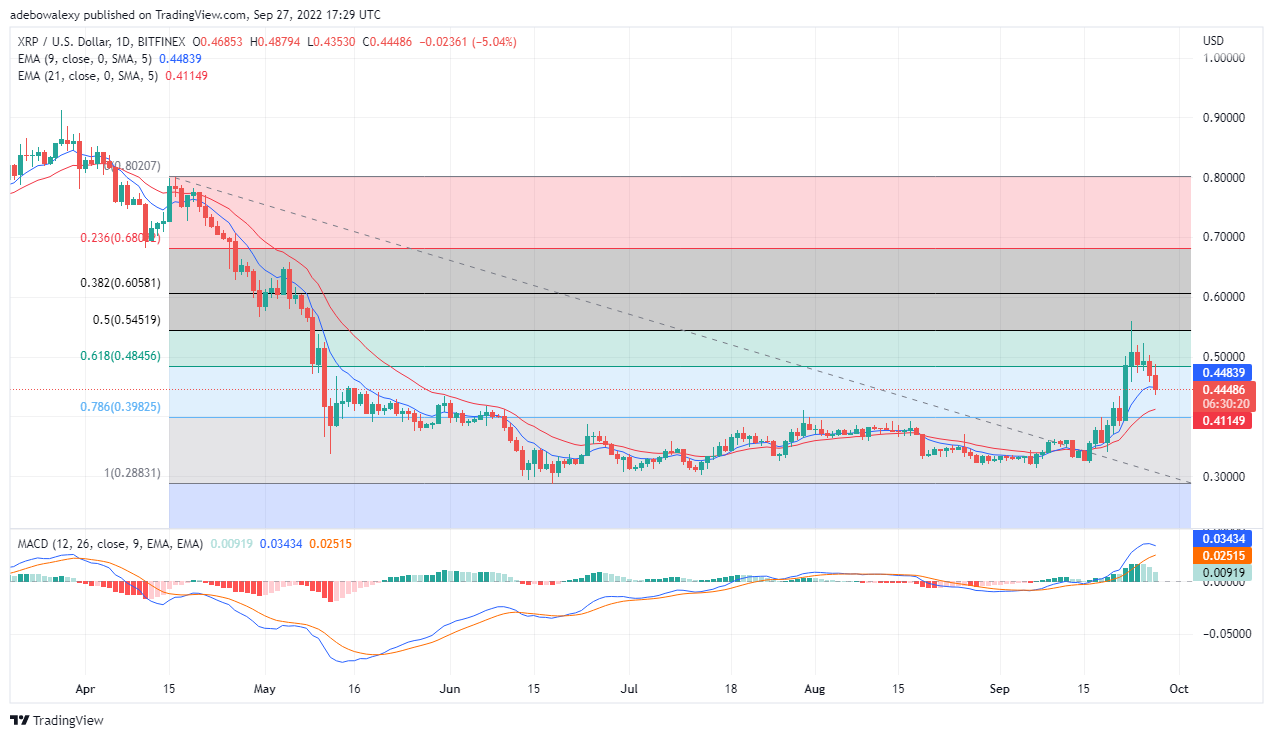
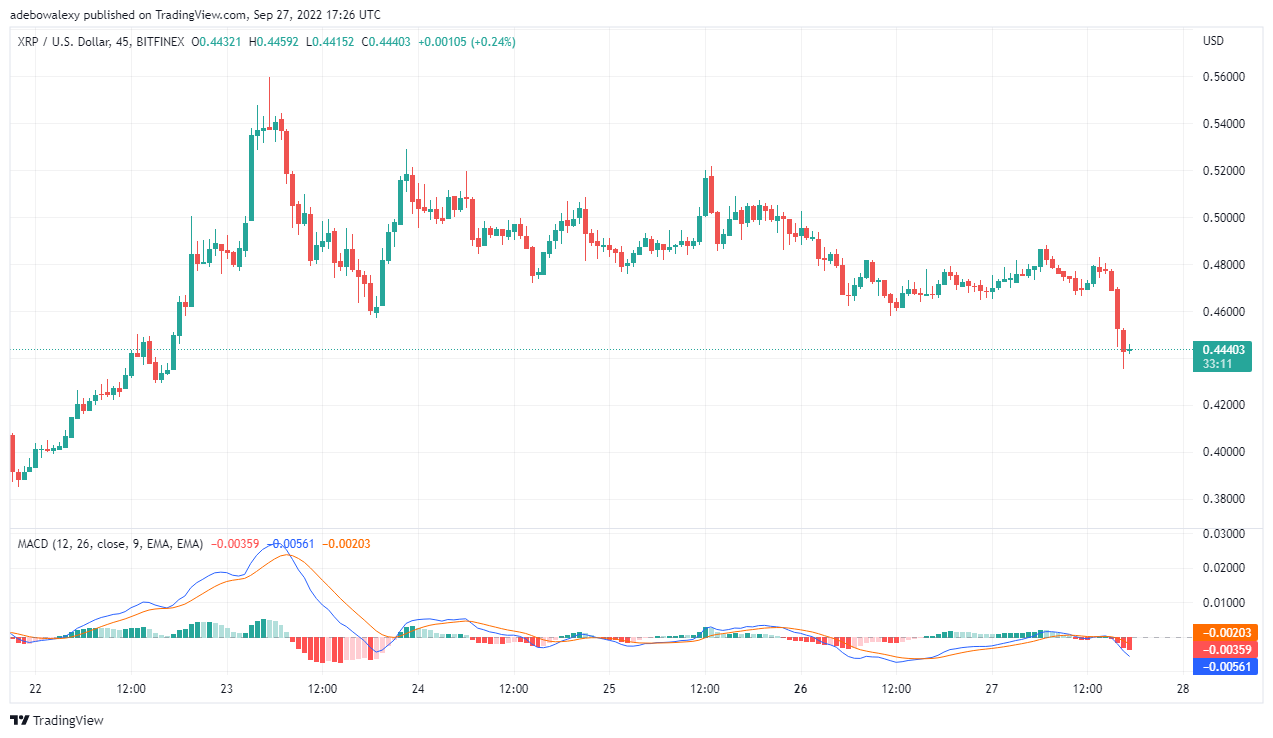
Ripple Value Analysis: XRP Broke Down the 78.60 Fib Level
XRP/USD price activity may fall below the 78.60 Fibonacci support since this support failed to hold. Over the last two sessions, sellers had the upper hand and this has pushed Rippley price downwards below the faster EMA line. Also, the MACD indicator lines after reaching the above the 0.00 mark are now making a bend to indicate the progressing downtrend. If these lines should eventually cut across each other, the price will progress further downwards. Additionally, since the price of XRP is still very much above the initial point of the most recent uptrend traders who entered the market then will consider going shot. Eventually, this will result in more price downside moves. Traders can then anticipate the price level of $0.3983 as a new entry point.
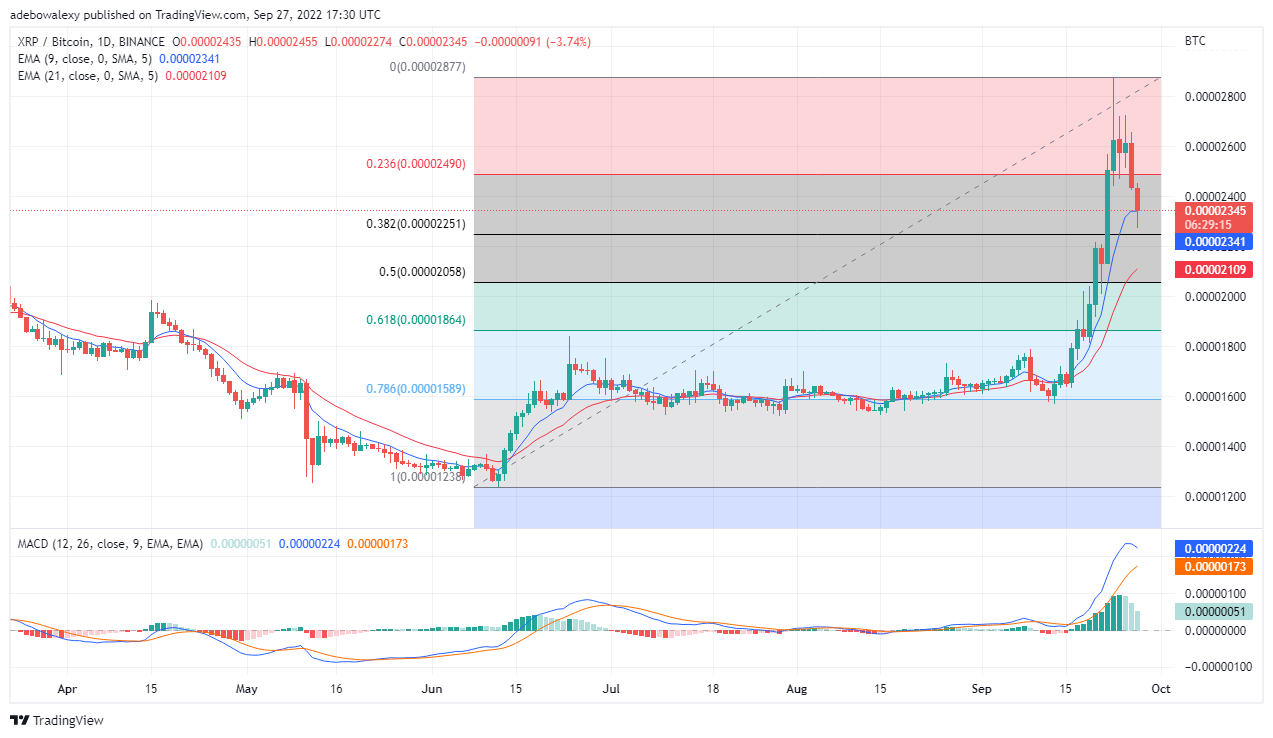
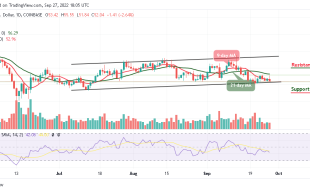
Ripple Value Analysis: XRP/BTC on a More Aggressive Downtrend
On the XRP/BTC front, price action is fiercely moving downwards. The size and frequency may be revealing how strong sellers are in this market. After the Fib level of 23.60 has failed the bears are now aiming at breaking the 38.20 of value 0.00002490.
Your capital is at risk.
The MACD indicator as well as portraying the current trend in this market, as its faster line is now curved towards the slower one. If the support of the 0.00002251 level hold, then price may rise upwards from here. Short-term traders can anticipate the fib level 38.20 as an entry point as we may experience an upward pullback at this level.
Join Our Telegram channel to stay up to date on breaking news coverage