Join Our Telegram channel to stay up to date on breaking news coverage
According to the daily chart, the Litecoin (LTC) price prediction may be looking for support at $50 where the market is likely to rebound.
Litecoin (LTC) Statistics Data:
- Litecoin price now – $52.04
- Litecoin market cap – $3.7 billion
- Litecoin circulating supply – 71.2 million
- Litecoin total supply – 84 million
- Litecoin Coinmarketcap ranking – #23
LTC/USD Market
Key Levels:
Resistance levels: $60, $62, $64
Support levels: $45, $43, $41
Your capital is at risk
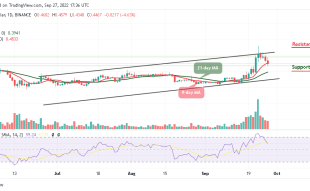
LTC/USD touches the daily high of $55.5 resistance level today but if the Litecoin price crosses below the lower boundary of the channel, the intraday traders may expect a negative close below the current market value of $52.04 level. At the time of writing, the buyers keep focusing on the downside, suggesting more bearish movements for the coin.
Litecoin Price May Form More Downs; FOMO on Tamadoge
As revealed by the daily chart, the Litecoin price may continue to experience a downtrend if it continues to trade below the 9-day and 21-day moving averages. However, if the coin falls beneath the support at $50, traders can expect the nearest support at $44 and then follow with added critical supports at $45, $43, and $41 below the lower boundary of the channel.
On the upside, if the bulls step back into the market, the Litecoin price may cross above the 21-day moving average and head towards the upper boundary of the channel as higher resistance levels could be found at $60, $62, and $64. Nevertheless, the signal line of the Relative Strength Index (14) is moving towards the 40-level which reveals that sellers may begin to control the market movement.
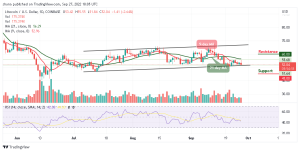
Against Bitcoin, the daily chart reveals that LTC is ranging as the coin retreats from the daily high of 2793 SAT. Meanwhile, an eventual break below the lower boundary of the channel may lead the coin towards the negative side.
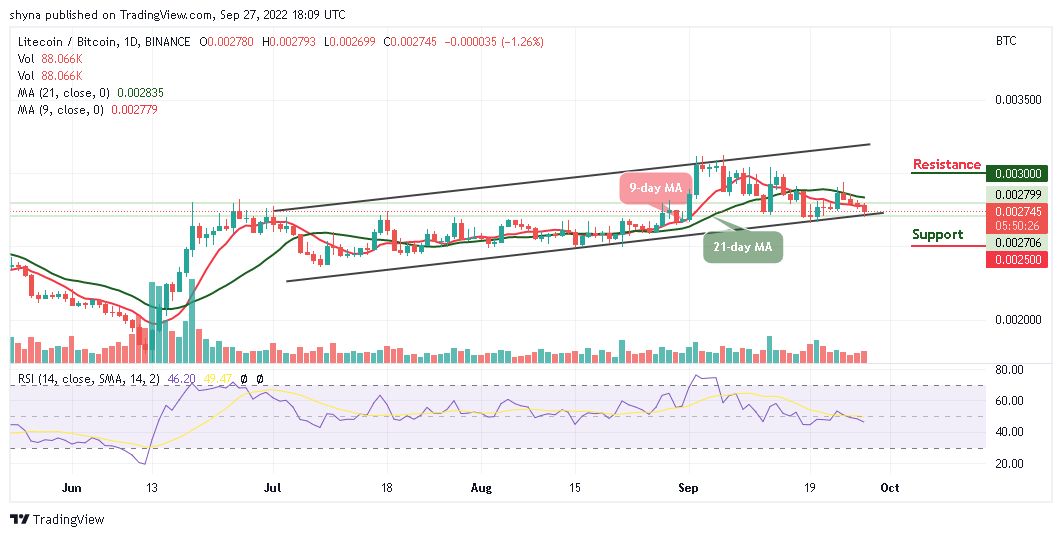
However, as the technical indicator Relative Strength Index (14) moves below the 50-level. Therefore, any bearish movement out of this zone could bring the coin to hit the major support at 2500 SAT and below. But if the buyers could return the price back above the 9-day and 21-day moving averages, LTC/BTC may likely reach the potential resistance at 3000 SAT and above.
OKX (formerly OKEx) is a centralized exchange (CEX) that also has its own DEX, where Tamadoge will also be tradeable – for those unable to register on OKX depending on their country of residence. The DEX listing will take place at 17:00 UTC, also on the 27th.
Join Our Telegram channel to stay up to date on breaking news coverage