Join Our Telegram channel to stay up to date on breaking news coverage
The Ripple (XRP) price may consolidate as the coin faces the downside, and traders may experience more downtrends.
Ripple Prediction Statistics Data:
- Ripple price now – $0.44
- Ripple market cap – $22.2 billion
- Ripple circulating supply – 49.9 billion
- Ripple total supply – 99.98 billion
- Ripple Coinmarketcap ranking – #6
XRP/USD Market
Key Levels:
Resistance levels: $0.55, $0.60, $0.65
Support levels: $0.40, $0.35, $0.30
Your capital is at risk
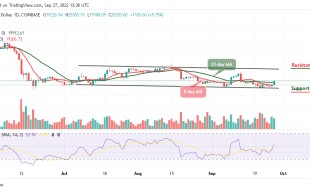
XRP/USD has been facing a market-wide struggle after sliding below the 9-day moving average. The coin is likely to stay within this negative side before deciding on the bullish movement. The current movement towards the lower boundary of the channel may create more damage to the coin for touching the low of $0.43 Following the path of all other coins, Ripple has made a cut of 4.63% in the last 24 hours and the coin is likely to dip below $0.42 support.
Ripple Price Faces the Downside, Tamadoge (TAMA) Remains Attractive
At the time of writing, the Ripple price is recovering from the daily low of $0.43 and any bearish cross below this support may open the doors for more downsides as the price could hit the support of $0.42. However, traders should keep eye on the daily high at $0.48 before creating a new bullish trend around the resistance levels of $0.55, $0.60, and $0.65.
However, should in case the price fails to rebound, there is likely a bearish breakout to trigger more selling opportunities within the market, which might cause the price to retest the support level of $0.43 and could further drop to $0.40, $0.35, and $0.30 support levels. The Relative Strength Index (14) crosses below the 60-level suggesting that the crypto may fall more.
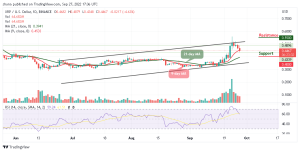
When compares with Bitcoin, the Ripple price is seen moving below the 9-day moving average. However, if the selling pressure continues, the Ripple price variation may head towards the 21-day moving average. At the moment, the Relative Strength Index (14) is sliding towards 60-level; traders may begin to see a negative move in the market.
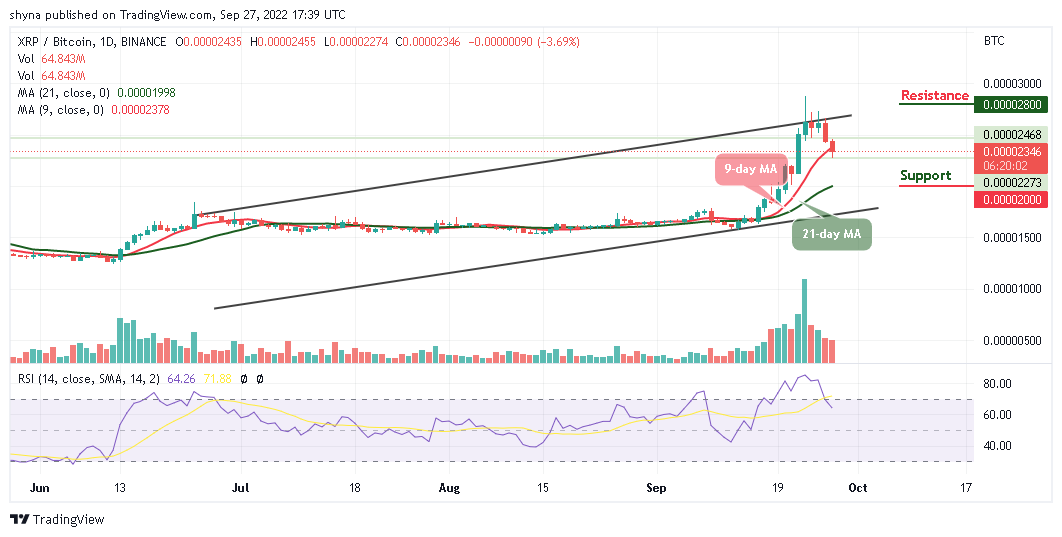
However, the Ripple is currently moving towards the south at 2346 SAT. Traders may expect close support at 2000 SAT and below. Therefore, should in case a bullish movement occurs and validates a break above the 9-day moving average; traders may confirm a bullish movement and the potential resistance level could be found at 2800 SAT and above.
OKX (formerly OKEx) is a centralized exchange (CEX) that also has its own DEX, where Tamadoge will also be tradeable – for those unable to register on OKX depending on their country of residence. The DEX listing will take place at 17:00 UTC, also on the 27th.
Join Our Telegram channel to stay up to date on breaking news coverage