

Join Our Telegram channel to stay up to date on breaking news coverage
XRP Price Analysis – June 18
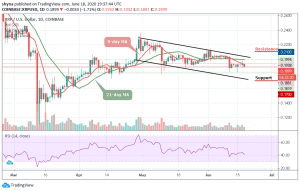
The Ripple (XRP) bulls hit resistance at $0.19, but the price may likely bounce back if the $0.18 could provide support.
XRP/USD Market
Key Levels:
Resistance levels: $0.210, $0.220, $0.230
Support levels: $0.170, $0.160, $0.150
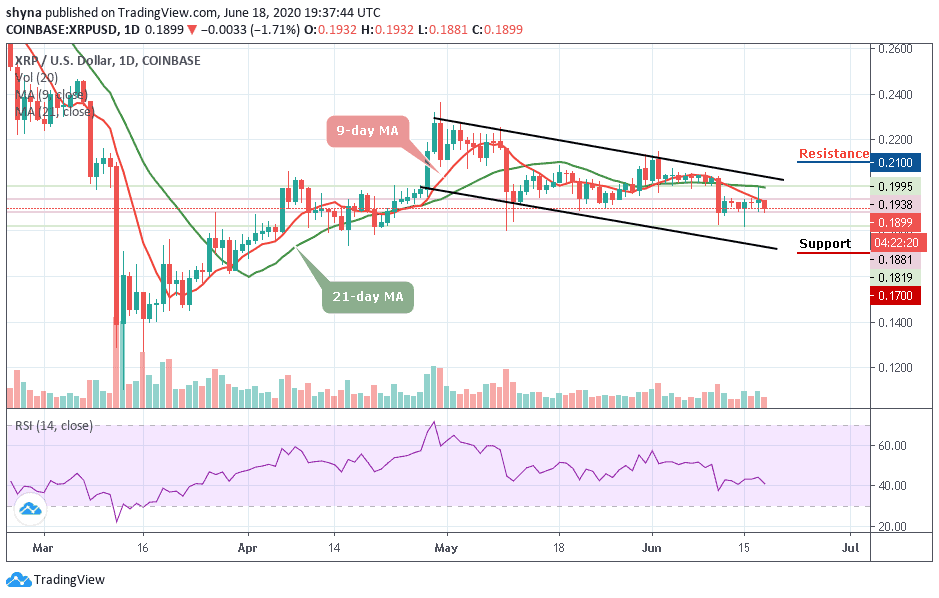
Looking at the daily chart, XRP/USD is now retreating to its lower limit. After falling from $0.199 today, the price of the XRP is now closer to the $0.185 support, which could offer a rebound level for the next bullish rally. For the past few days, the bearish impulse movement has been suspended. Should the bears exhaust momentum around the $0.180 support level, a bullish continuation is expected to occur.
Meanwhile, if the bears are out of breath around the support area mentioned, a bullish pursuit is expected. However, we should keep an eye on the $0.190 and $0.200 before printing a new high at the resistance levels of $0.210, $0.220, and $0.250. Nevertheless, the XRP bear dictates the pace for the moment in the long term but remains to range on the short-term outlook.
More so, we should expect a quick buy once the trade reaches the wedge’s support at $0.180. And if the price fails to rebound, then a bearish breakout is likely to trigger more selling opportunity for traders, which might cause the price to retest the low at $0.170 and could further drop to $0.160, and $0.150 support levels respectively. The RSI (14) is about to move below the 40-level. Meanwhile, if it oscillates downward, the price to buy Ripple (XRP) may fall.
Against Bitcoin, for the past few days now, Ripple (XRP) has been falling drastically below the moving averages but the bulls are trying to step back into the market. If the bulls try to step back into the market, we can expect the price-rise to 2150 SAT and 2250 SAT resistance levels.
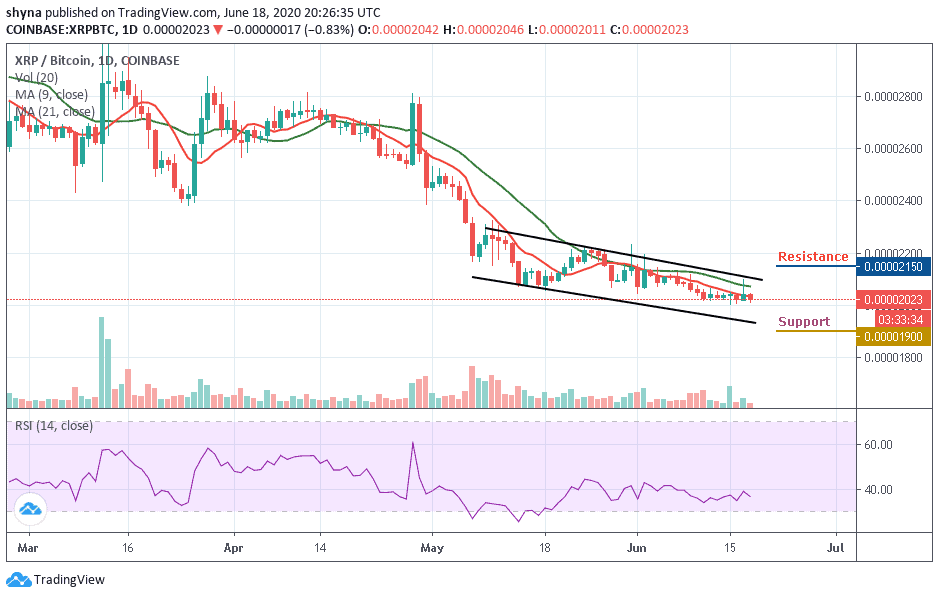
However, if the sellers continue to push the price down below the moving averages within the descending channel, the next support level is located at 2000 SAT and further support is found at the 1900 SAT and 1800 SAT. The RSI (14) is moving below the 40-level, which may likely give more strength to the sellers.
Please note: Insidebitcoins.com is not a financial advisor. Do your research before investing your funds in any financial asset or presented product or event. We are not responsible for your investing results.
Join Our Telegram channel to stay up to date on breaking news coverage
