Join Our Telegram channel to stay up to date on breaking news coverage
Bitcoin (BTC) Price Prediction – June 18
As the entire market is flat, the Bitcoin (BTC) has not seen any notable continuation after two bullish reversal candlesticks.
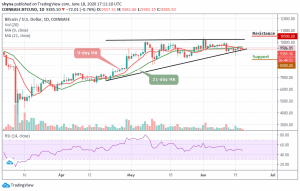
BTC/USD Long-term Trend: Bullish (Daily Chart)
Key levels:
Resistance Levels: $10,500, $10,700, $10,900
Support Levels: $8,500, $8,300, $8,100

BTC/USD drops below the level of psychological support at $9,400 in the early hours of trading today, as the buyers take a break from the prolonged uptrend that the superior crypto has experienced since the beginning of this month. At the time of writing, the Bitcoin chart is now signaling an upcoming bearish run as the price may be facing a downtrend trading at $9,385.
However, in one of the most shocking moves earlier yesterday, the Bitcoin bulls lost their strength holding on to the key support level at $9,300, as bears took over the market to push BTC price below the 9-day and 21-day moving averages. The Bitcoin price set to drop lower as the market adjusts from the skyrocketing momentum in the past month or so.
Moreover, in the case of an upward trend, the next possible target is the $9,700 support turned resistance level. The next major level is $10,000 while the potential resistance levels are $10,500, $10,700, and $10,900 while the critical support levels are $8,500, $8,300, and $8,100 as the RSI (14) moves below the 50-level.
BTC/USD Medium – Term Trend: Ranging (4H Chart)
Bitcoin’s price is still trading around $9,397 after rebounding from $9,228 in yesterday’s trading. Looking at the hourly price chart, we can see that the bearish supply is coming up slowly in the market, but the bulls are also trying to defend the $9,300 supports. Meanwhile, the $9,200 support level and below may come into play if BTC breaks the mentioned support.
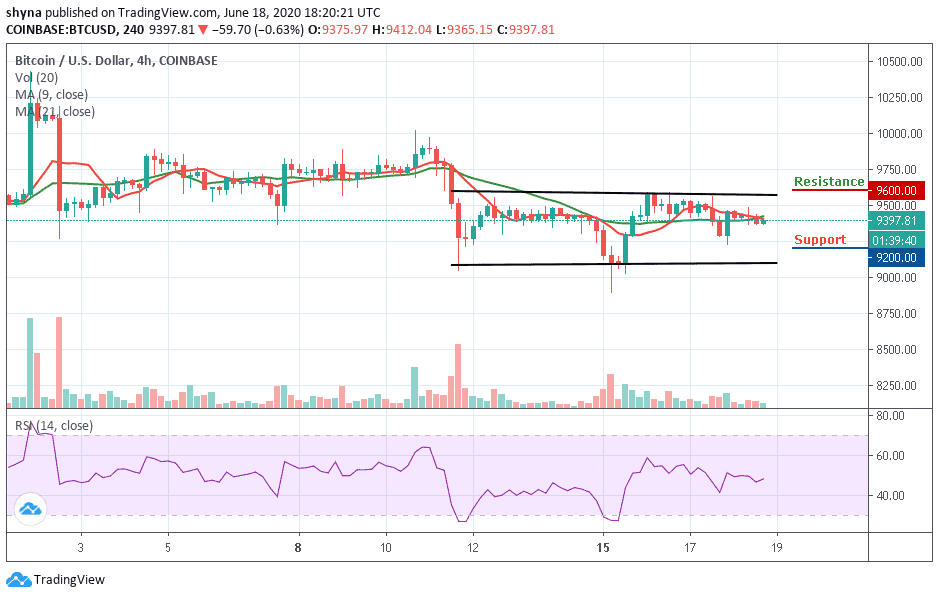
However, if buyers strengthen and energize the market, traders may expect a retest of $9,500 resistance level. Therefore, breaking the mentioned resistance could also allow the bulls to test the $9,600, $9,800, and $10,000 upward. Nonetheless, BTC/USD is consolidating currently and moving sideways on the medium-term outlook. We can expect an increase in volatility soon.
Please note: Insidebitcoins.com is not a financial advisor. Do your research before investing your funds in any financial asset or presented product or event. We are not responsible for your investing results.
Join Our Telegram channel to stay up to date on breaking news coverage