

Join Our Telegram channel to stay up to date on breaking news coverage
XRP Price Prediction – June 10
The price of Ripple is improving as the coin is now consolidating in an intraday zone between $0.200 and $0.205.
XRP/USD Market
Key Levels:
Resistance levels: $0.22, $0.23, $0.24
Support levels: $0.18, $0.17, $0.16
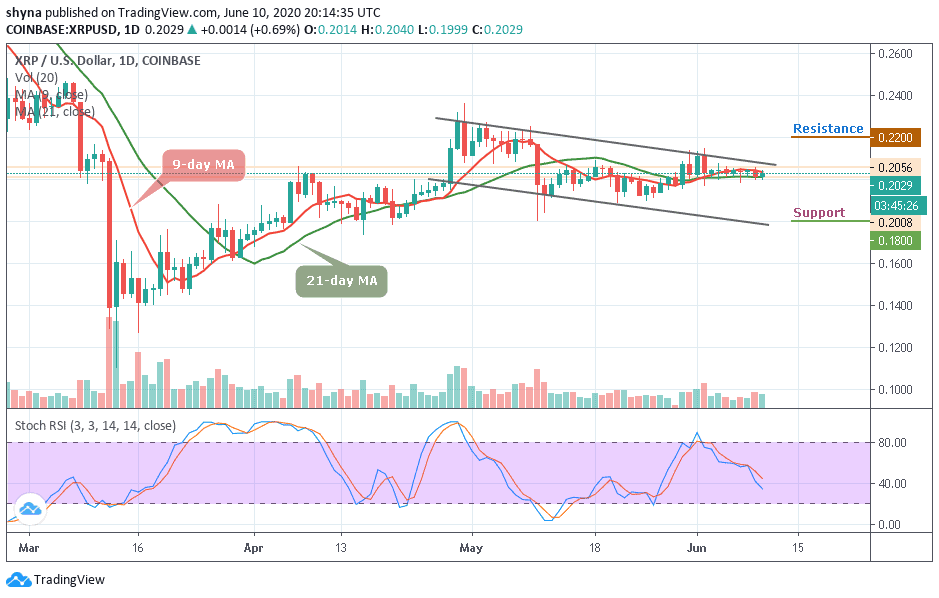
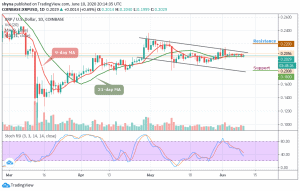
XRP/USD continues to consolidate its position below the $0.20 level. At the time of writing, the coin is floating towards the upper limit of the channel as the stochastic RSI indicator moves below 45-level. The daily breakdown shows that the intraday support and resistance lie between $0.200 and $0.205 respectively.
Meanwhile, the third largest-cryptocurrency is witnessing a bullish drive against USD but currently trading at $0.202. Therefore, since the XRP/USD is following a sideways movement on a short-term outlook as it has been revealed by the technical indicator, traders may expect the trend to break below the 9-day and 21-day moving averages if the price actions still remain inside the channel.
Moreover, a channel breakdown could strengthen the bears and this could push the price to the support levels of $0.18, $0.16, and $0.15 or a channel breakout might lead the market in a bullish scenario if the price continues to follow the upward trend and the nearest resistance to keep an eye on are $0.22, $0.23, and $0.24.
Against Bitcoin, the price to buy Ripple is consolidating within the channel and trading below the 9-day and 21-day moving averages. However, if the bulls could energize and push the price above the upper boundary channel, the bullish continuation may likely take it to the resistance levels of 2200 SAT and 2300 SAT respectively.
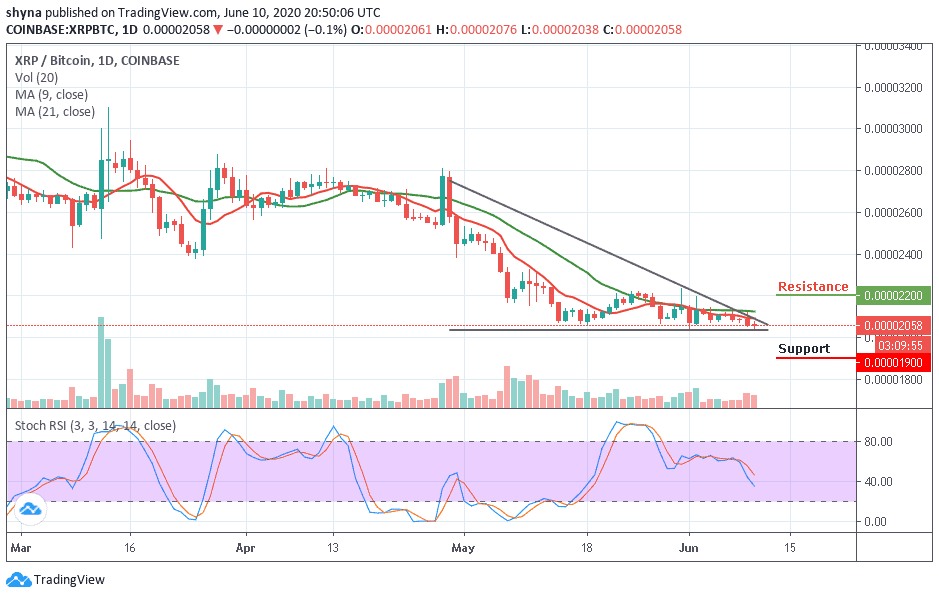
In other words, if the bulls couldn’t regroup to halt the selling pressure and the coin drop below the channel, XRP/BTC may follow the downward trend and the nearest support levels for the coin lies at 1900 SAT and 1800 SAT respectively. More so, the RSI (14) is moving below 50-level, which indicates a downward movement for the coin.
Please note: Insidebitcoins.com is not a financial advisor. Do your research before investing your funds in any financial asset or presented product or event. We are not responsible for your investing results.
Join Our Telegram channel to stay up to date on breaking news coverage
