Join Our Telegram channel to stay up to date on breaking news coverage
Bitcoin (BTC) Price Prediction – June 10
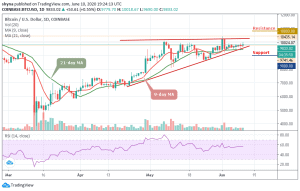
Bitcoin is now trading at $9,833 after another rejection although it managed to break above $10,000 on the daily chart.
BTC/USD Long-term Trend: Bullish (Daily Chart)
Key levels:
Resistance Levels: $10,800, $11,000, $11,000
Support Levels: $9,000, $8,800, $8,600

BTC/USD is trying to climb above $10,000 for the second time this month as the bulls are having a tough time trying to break above this crucial level. This rejection could scare buyers away as the Bitcoin market has been quite flat except for a few false breakouts. As we have seen several times in the past, the $10,000 threshold has proven to be a crucial resistance for Bitcoin and it remains unclear whether the bulls will be able to push BTC confidently above the resistance in the weeks ahead.
Looking at the daily chart, BTC/USD is likely to continue with the uptrend targeting $10,000 in the short term. However, the bulls have a task to keep the price above $10,000 and even pull above $10,200. A step past $10,200 would encourage more buyers to join the market for another run towards $11,000. Meanwhile, the technical indicator retreating movement suggests sellers are gaining traction as the RSI (14) is yet to cross above 60-level.
Moreover, any failure by the bulls to move the price above the channel, traders may see a price cut below the 9-day and 21-day moving averages. A further low drive could send the price to $9,000, $8,800, and $8,600 supports. For now, the bulls are still dominating the market. But as it stands now, the Bitcoin price may continue to follow the upward trend while the nearest resistance lies at $10,800, $11,000, and $11,200 levels.
BTC/USD Medium – Term Trend: Bullish (4H Chart)
Looking at the 4-hour chart, BTC/USD is currently trading around $9,892 and above the 9-day and 21-day moving averages after a reversal from $9,689 that occurs today. However, the 4-hour chart shows that the bullish supply is coming up slowly in the market while the bears are also trying to bring the price down.

However, if the buyers could strengthen and energize the market more, they can further push the price to a $10,000 resistance level. Therefore, breaking the mentioned resistance may likely allow the bulls to test the $10,100 and above. In other words, the RSI (14) is currently moving above 60-level, but when it turns down; the bears could step back into the market and bring the price to the supports of $9,600 and below.
Please note: Insidebitcoins.com is not a financial advisor. Do your research before investing your funds in any financial asset or presented product or event. We are not responsible for your investing results.
Join Our Telegram channel to stay up to date on breaking news coverage