Join Our Telegram channel to stay up to date on breaking news coverage
The Ripple price prediction shows that XRP is attempting to cross above the upper boundary of the channel.
Ripple Prediction Statistics Data:
- Ripple price now – $0.52
- Ripple market cap – $27.2 billion
- Ripple circulating supply – 51.9 billion
- Ripple total supply – 99.9 billion
- Ripple Coinmarketcap ranking – #6
XRP/USD Market
Key Levels:
Resistance levels: 0.60, $0.0.64, $0.0.66
Support levels: $0.42, $0.40, $0.38
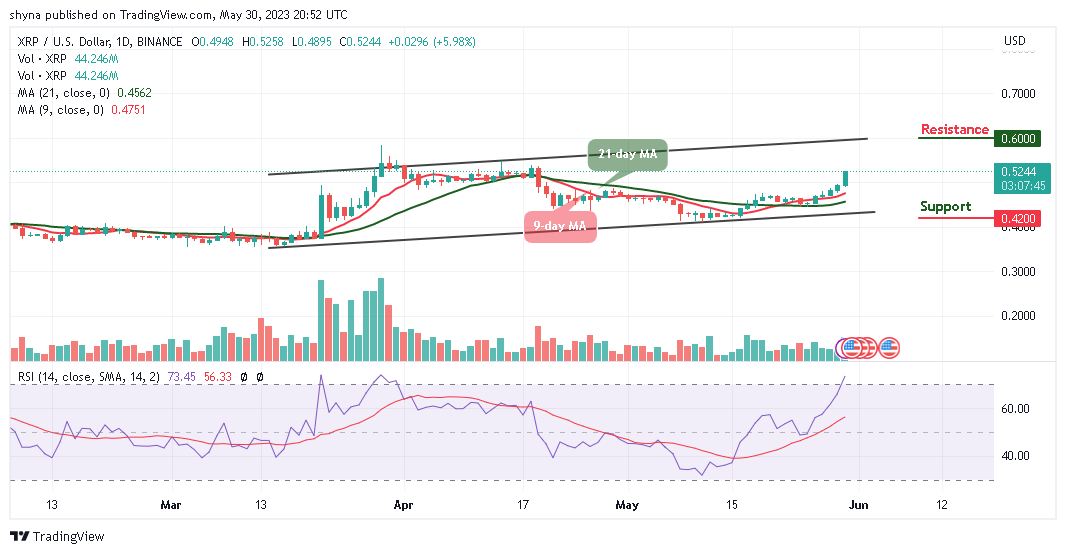
XRP/USD peaks at $0.52 today, as the coin heads toward the upper boundary of the channel. However, Ripple (XRP) will have to stay above the 9-day and 21-day moving averages in other to guide against the downward pressure while the closest support expects the coin at $0.45, which could be a daily low.
Ripple Price Prediction: Ripple Likely to Hit $0.70 High
At the time of writing, Ripple (XRP) is likely to trend to the upside. However, the movement above the upper boundary of the channel could push the coin to the resistance levels of $0.60, $0.62, and $0.64. On the downside, a bearish movement below the 9-day and 21-day moving averages could stop the initial upward movement and create bearish momentum with the focus to bring the market to the next support levels at $0.42, $0.40, and $0.38 respectively.
At the moment, the technical indicator Relative Strength Index (14) crosses above the 70-level, which indicates that the market may continue with the uptrend. Looking at the daily chart, the 9-day moving average remains above the 21-day moving average which could allow the buyers to concentrate on stirring action to the north.
Compares with Bitcoin, the Ripple is hovering above the 9-day and 21-day moving averages. Meanwhile, following the recent positive sign, the XRP price may slightly go down if the sellers resume back into the market.
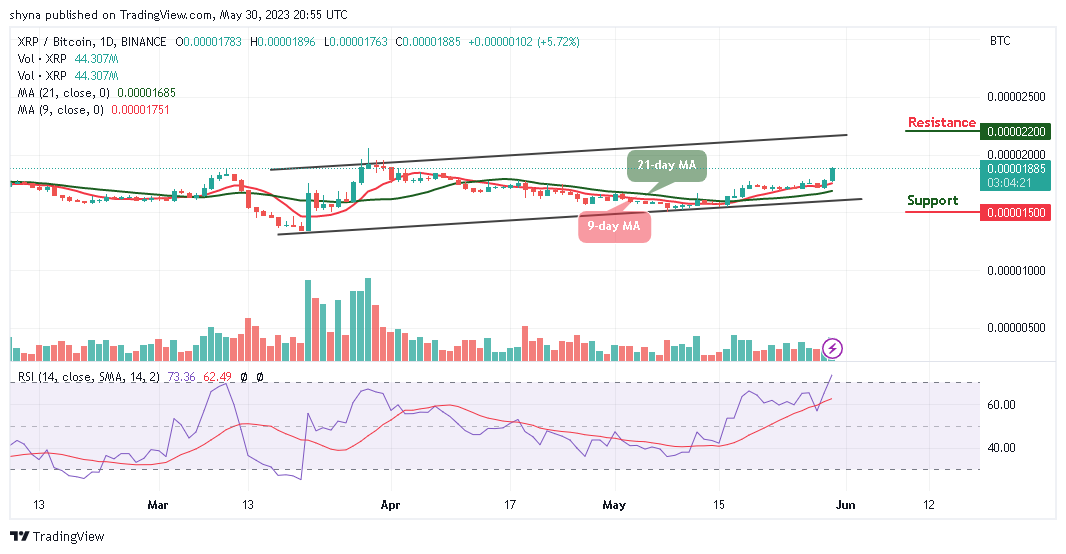
Therefore, if the bears break below the moving averages, the market price could reach the support level at 1500 SAT and below. Nevertheless, any further bullish movement could allow the coin to go above the upper boundary of the channel to hit the resistance level of 2200 SAT and above as the technical indicator Relative Strength Index (14) moves into the overbought region.
Ripple Alternatives
At the time of writing, the Ripple price keeps following the uptrend as the bulls dominate the market. Meanwhile, if XRP/USD sees a shift in momentum, the bulls may need to push the price above the upper boundary of the channel. Therefore, traders should keep monitoring the movement of the coin for the next possible direction. However, Wall Street Memes is a new presale meme coin launched by the creators of the 2021 NFT project, Wall St Bulls. The project already has a combined following of over one million and has notably received multiple Twitter engagements from Elon Musk. So far, the presale has raised almost $2m since the launch.
New OKX Listing - Wall Street Memes

- Established Community of Stocks & Crypto Traders
- Featured on Cointelegraph, CoinMarketCap, Yahoo Finance
- Rated Best Crypto to Buy Now In Meme Coin Sector
- Team Behind OpenSea NFT Collection - Wall St Bulls
- Tweets Replied to by Elon Musk
Read more:
- Ripple Price Prediction: XRP/USD Sustains Recent Rallies, Can Trigger on the Upside
- Ripple Price Prediction: XRP/USD Struggles as the Price Remains Below $0.230
- AUDJPY Is Trending Downwards Below $75 Level and This May Continue
Join Our Telegram channel to stay up to date on breaking news coverage