Join Our Telegram channel to stay up to date on breaking news coverage
XRP Price Prediction – September 23
The Ripple price is in grave danger of losing to $0.200 support as long as it stays below the moving averages.
XRP/USD Market
Key Levels:
Resistance levels: $0.260, $0.270, $0.280
Support levels: $0.200, $0.190, $0.180

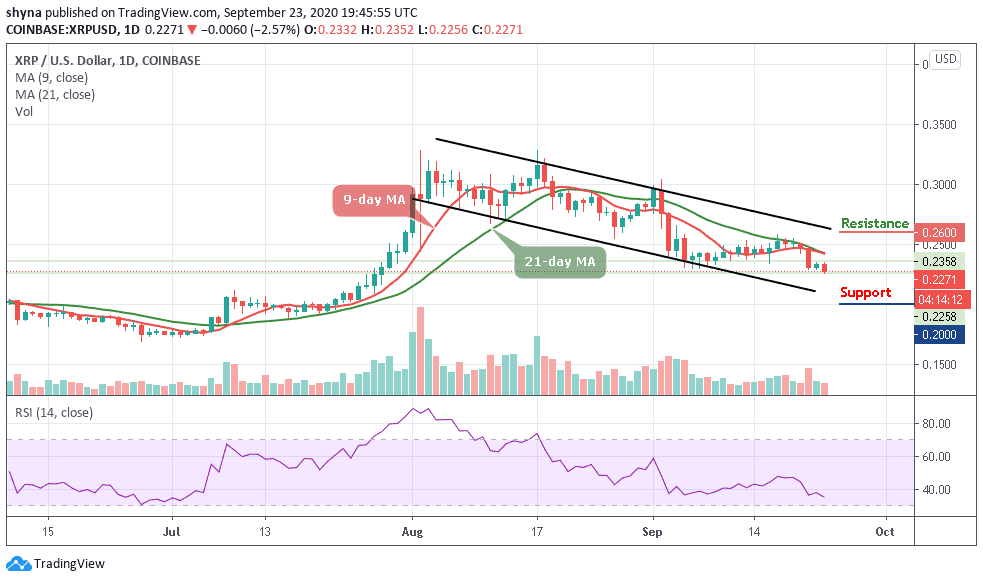
At the moment, XRP/USD is displaying no strong growth. In the last few days, the Ripple price has decreased by almost 4.5%. At the time of writing, XRP/USD is sitting at $0.227 after the bulls have worked to build a few higher lows but fails. Currently, the Ripple price is seen struggling to climb above the 9-day and 21-day moving averages for quite some time and it’s now fighting to hold the $0.220 support.
What is the Next Direction for Ripple?
The daily chart shows that the bearish move is stepping back into the market today after yesterday’s bulls. The support level at $0.228 has been broken, with the prices moving out of the structure and starting a bearish move. This is confirmed by the technical indicator RSI (14) which is currently approaching the oversold region. This shows that the crypto is still biased for the short, with a high likelihood of breaking the support level at $0.225.
However, the next target supports for Ripple could be below the lower boundary of the channel at $0.200, $0.190, and of course, the psychological level at $0.180. More so, a bounce from any of these levels could push the Ripple price above $0.250 again and could create a stability pattern in the forthcoming weeks as the potential resistance levels can be found at $0.260, $0.270, and $0.280 respectively.
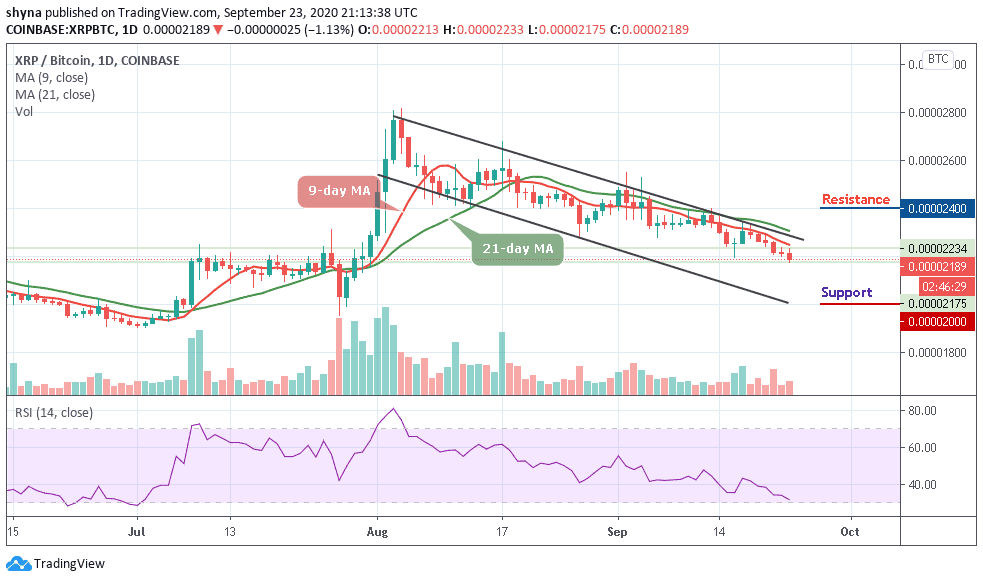
Comparing with Bitcoin, XRP is still trading on the downside, although the price action has remained intact within the descending channel. If the selling pressure persists, the XRP price variation may likely create a new low in the coming days. For now, the RSI (14) is seen facing the oversold region; traders may see additional negative move in the market.

However, the coin is currently trading below the moving averages at 2189 SAT. The close support can be expected at 2100 SAT before breaking to 2000 SAT and below. Any bullish movement above the moving averages can confirm a bull-run for the market and the closest resistance levels lie at 2400 SAT and above.
Join Our Telegram channel to stay up to date on breaking news coverage

