
Join Our Telegram channel to stay up to date on breaking news coverage
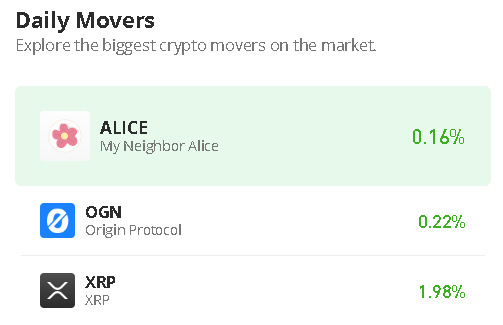
The Ripple price prediction shows that XRP is rising slightly with a gain of 1.36% during the European session today.
Ripple Prediction Statistics Data:
- Ripple price now – $0.43
- Ripple market cap – $22.5 billion
- Ripple circulating supply – 51.8 billion
- Ripple total supply – 99.98 billion
- Ripple Coinmarketcap ranking – #6
XRP/USD Market
Key Levels:
Resistance levels: $0.55, $0.60, $0.65
Support levels: $0.30, $0.25, $0.20
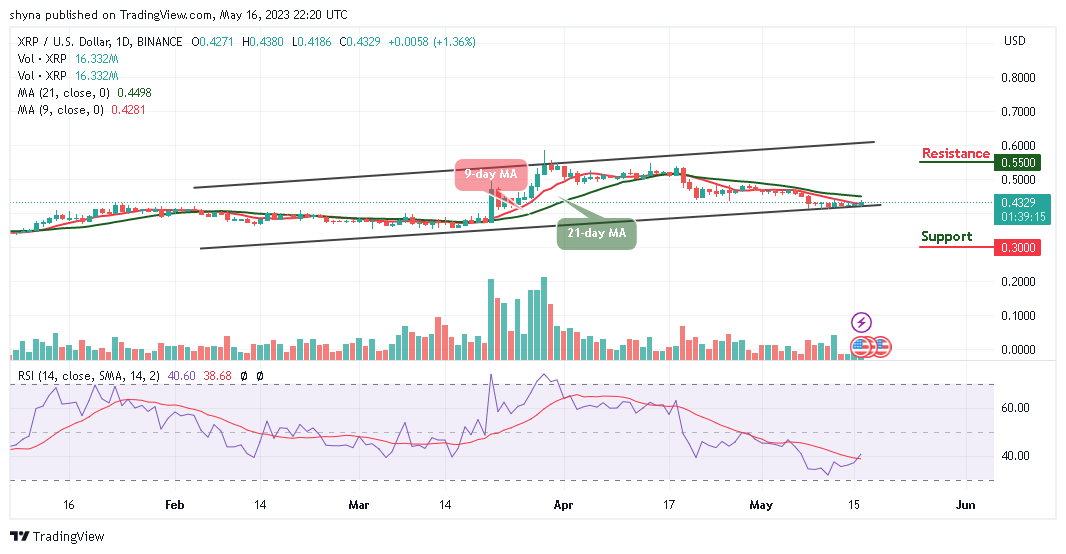
XRP/USD is trading above the opening price of $0.42 as the coin heads to the upside. It could be possible that if the resistance level of $0.45 is tested, it is likely for the coin to break higher. Meanwhile, if the Ripple price remains below the 9-day and 21-day moving averages, traders could expect the market price to break beneath, and this may likely touch the critical support levels at $0.30, $0.25, and $0.20.
Ripple Price Prediction: Ripple (XRP) May Face the Upside
According to the daily chart, the Ripple price is hovering around $0.43 with a slight bullish movement above the 9-day moving average. However, if the bulls put more pressure, the Ripple price may cross above the 21-day moving average to hit the resistance levels at $0.55, $0.60, and $0.65.
On the other hand, the technical indicator Relative Strength Index (14) is beginning to recover as the signal line crosses above the 40-level. In the meantime, the bulls may come into focus if a larger divergence to the upside is noticed within the market.
Against Bitcoin, the Ripple price is ranging within the 9-day and 21-day moving averages. After bottoming out around the 1549 SAT, the price begins to slowly ascend and it is currently trading around the 1605 SAT. However, the Ripple price is now moving within the channel as the buyers are likely to come into the market. From above, if the bulls can push the coin above the 9-day moving average, traders may expect initial resistance to be located at 1800 SAT.
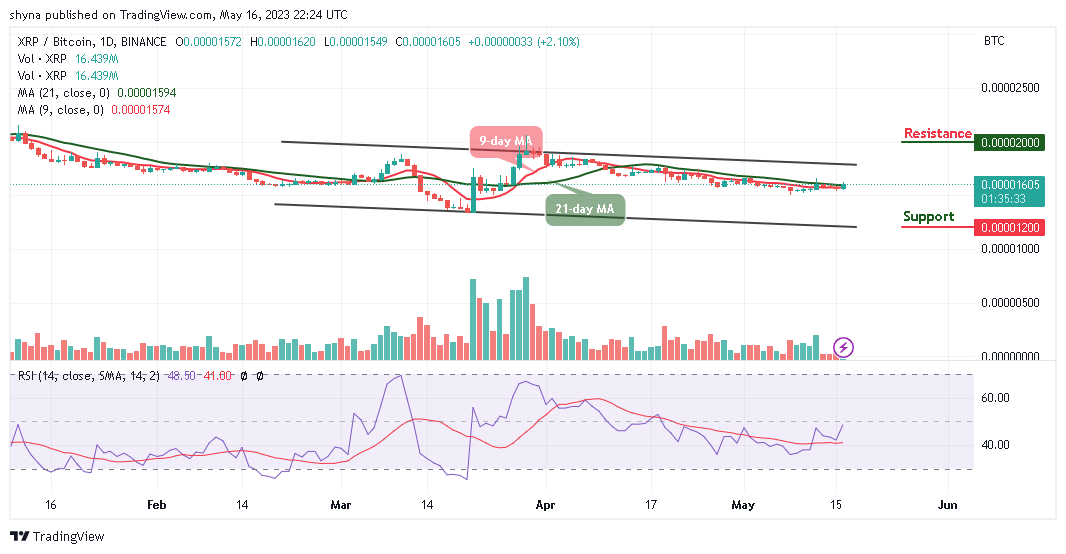
Therefore, any further bullish movement may hit a higher resistance level at 2000 SAT and above. Alternatively, If the sellers push the market below the lower boundary of the channel, XRP/USD may hit the support at 1200 SAT and below. Meanwhile, the Relative Strength Index (14) is likely to create more bullish signals as the signal line moves to cross above the 50-level.
Alternatives to Ripple
According to the daily chart, the Ripple price is moving toward the resistance level of $0.55 as the initial move toward the upper boundary of the channel could boost the price further up. Looking at it from above, more bullish movements may come into play if the Ripple price crosses above the moving averages. However, in the case of AiDoge, users need to use credits every time they wish to create a new meme. Users will need to use $AI to buy credits. This means the AiDoge tokens will remain in demand for as long as people wish to use its meme-generation tool. That’s why the new platform has raised more than $10 million in presale thus far, even though it hasn’t been live for all that long.
Read more:
Join Our Telegram channel to stay up to date on breaking news coverage