Join Our Telegram channel to stay up to date on breaking news coverage
XRP Price Analysis – October 21
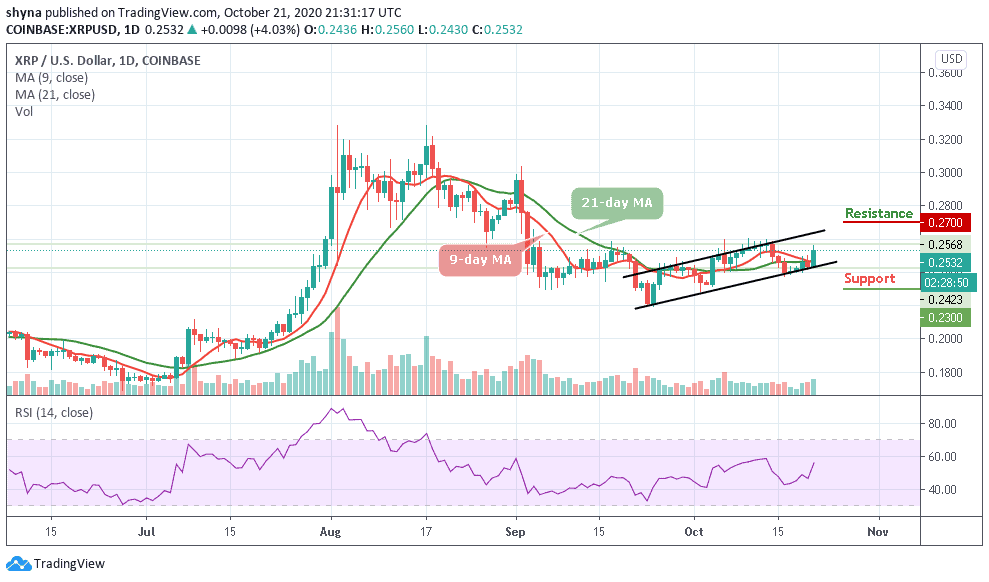
Since September 4, XRP/USD has been on a downward correction after the last bearish impulse to the low of $0.22. Meanwhile, buyers also made positive moves to push XRP out of downward correction but to no avail. The coin is facing rejection at $0.26. The XRP/BTC is in a downward move and selling pressure is likely to continue.
XRP/USD Market
Key Levels:
Resistance Levels: $0.24, $0.26, $0.28
Support Levels: $0.22, $0.20, $0.18

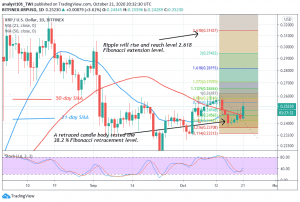
For the past week, Ripple has been on a downward move after facing rejection from the $0.26 high. Buyers fail to overcome the resistance at $0.26. All through last week, the coin has been on a downward move. On October 16, XRP resumes a fresh uptrend as the market reached a high of $0.252. For the past one month, the uptrend has been hampered because of the resistance at $0.26. However, XRP has another chance of an upward move. On October 12 uptrend, the coin was resisted but the retraced candle body tested the 38.2% Fibonacci retracement level. With this retracement, the coin is capable of rising to level 2.618 Fibonacci extensions. In other words, the coin will reach a high of $0.314.
Ripple (XRP) Indicator Analysis
Ripple is rising because the price bars are above the SMAs. The 21-day and 50-day SMAs are sloping upward indicating the upward. Nonetheless, XRP is in a bullish momentum above the 40% range of the daily stochastic.

In the case of XRP/BTC, the crypto has been on a downward move since August. On October 4, the coin rebounded and retested the resistance at level Ƀ0.000023000. Buyers could not break the resistance as the downtrend resumes. Today, the market has fallen and reached level Ƀ0.000019740. According to the Fibonacci tool, the market will further depreciate to the downside. On October 2 downtrend; a retraced candle body tested the 61.8% Fibonacci retracement level. It indicates that the market will further depreciate to a level of 1.618 Fibonacci extension. This is equivalent to level Ƀ0.000019235.
Join Our Telegram channel to stay up to date on breaking news coverage