Join Our Telegram channel to stay up to date on breaking news coverage
XRP Price Prediction – October 21
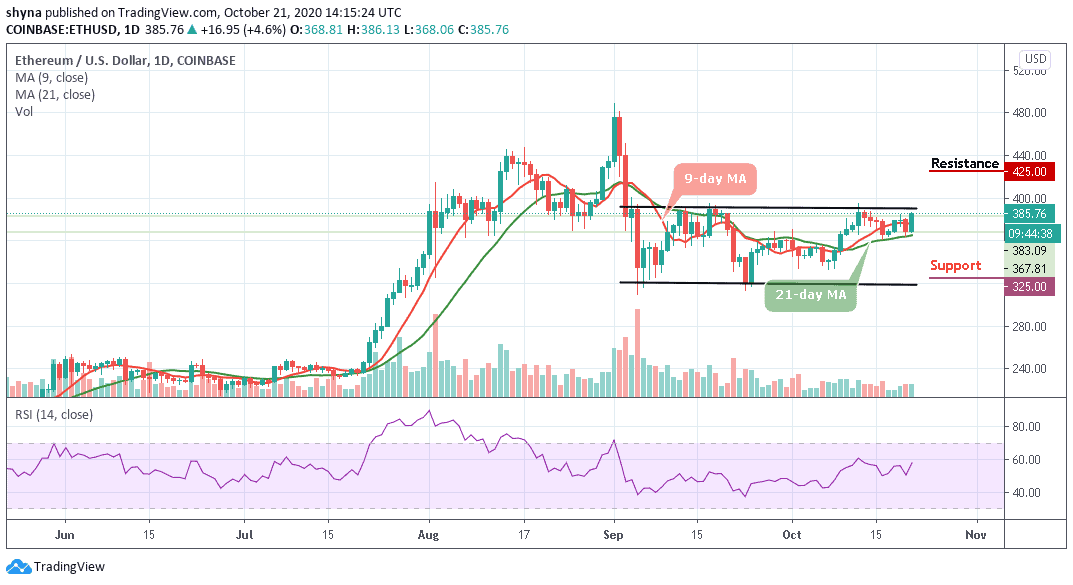
Ripple (XRP) touched the daily high of $0.256 and it is likely to continue higher towards the $0.260 resistance level.
XRP/USD Market
Key Levels:
Resistance levels: $0.270, $0.280, $0.290
Support levels: $0.230, $0.220, $0.210
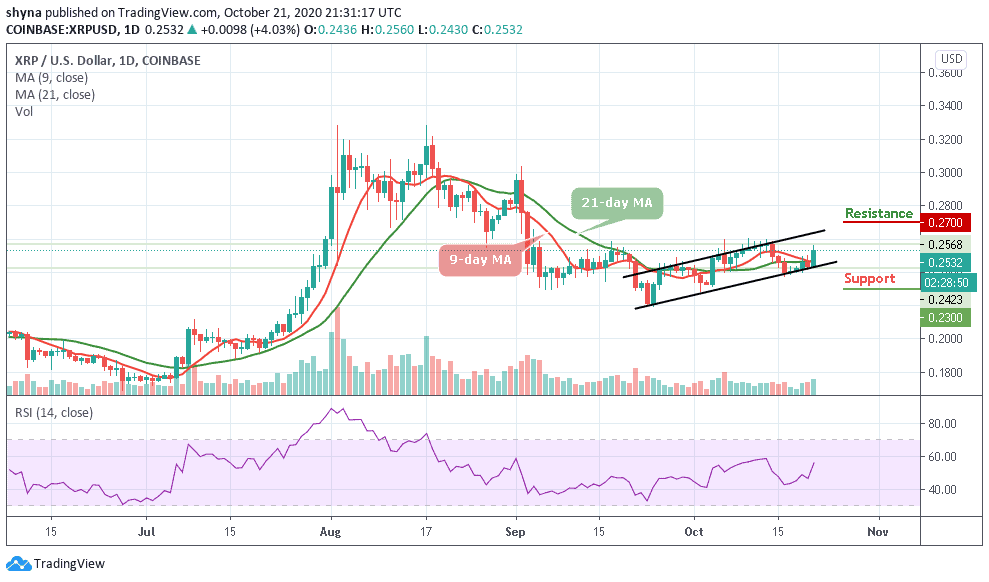
Today, XRP/USD experiences a significant boost that allowed the coin to exceed the $0.250 level, this momentum extending considerably as crypto continues to climb higher today. The current performance of the coin indicates the addition of an upward movement for a few days ago. It’s just a matter of time for this coin to reach a $0.260 level in the nearest term.
What is Next for Ripple (XRP)?
For XRP/USD, the hope for gains above $0.260 is not yet lost, at least for now, the market price remains above the 9-day and 21-day moving averages. On the bright side, this shows that buyers are still controlling the market at the moment. This time, the market price may likely stay within this barrier for it to head to the north. However, if the coin decides to follow the downward movement, crossing below the lower boundary of the channel may meet the supports at $0.230, $0.220, and $0.210 respectively.
Moreover, XRP/USD bulls have been maintaining the upward movement and the market price has gone up to $0.256 in the early hours of today before retreating to where it is trading currently at $0.253. More bullish action is expected if Ripple managed to clear the resistance level of $0.265. This may cause the price to hit the potential resistance levels of $0.270, $0.280, and $0.290.
Against Bitcoin, for the past few weeks, Ripple (XRP) has been falling drastically below the moving averages as the bulls failed to step back into the market. if the sellers continue to push the price down below the moving averages within the descending channel, the next support level is located at 1900 SAT and further support may be found at 1800 SAT and 1700 SAT respectively.

However, If the bulls try to step back into the market, traders can expect the price-rise to 2200 SAT and 2300 SAT resistance levels. Meanwhile, the RSI (14) is moving within the oversold region, suggesting more bearish signals into the market.
Join Our Telegram channel to stay up to date on breaking news coverage