Join Our Telegram channel to stay up to date on breaking news coverage
The Quant price prediction shows that QNT failed to cross above the upper boundary of the channel as the selling pressure takes over the market.
Quant Prediction Statistics Data:
- Quant price now – $201.16
- Quant market cap – $2.4 billion
- Quant circulating supply – 12 million
- Quant total supply – 14.6 million
- Quant Coinmarketcap ranking – #29
QNT/USD Market
Key Levels:
Resistance levels: $255, $265, $275
Support levels: $155, $145, $135
QNT/USD is likely to slow down the bullish movement and could settle below the $200 support level. The market price breaks down today, touching its lowest daily level at $191.56. However, the current performance of the Quant is below normal expectations as the coin may gain more downtrends in the next negative direction.
Quant Price Prediction: What Could Be the Next Direction?
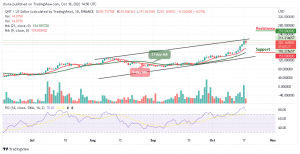
If the Quant price fails to push the price above the upper boundary of the channel, there is a risk of a fresh bearish movement. However, if the coin drops below the 9-day and 21-day moving averages, the initial support may be located at the $180 level where the market price could restart its decline.
As the technical indicator Relative Strength Index (14) reveals the possible downtrend, any bearish movement out of the overbought region could lead to critical supports at $155, $145, and $135. Nevertheless, a high swing above the upper boundary of the channel could take the bulls to a key resistance level of $240. If this is possible, the coin may trigger a bullish rally which could take the market price to the resistance level of $255, $265, and $275.
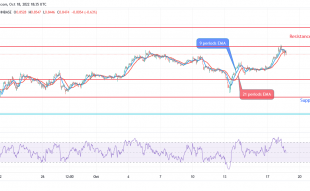
Against Bitcoin, the daily chart reveals that the sellers are now showing some commitment to the market movement. However, following the recent negative sign, the trend may continue to go down if the bears keep on putting more pressure on the market.
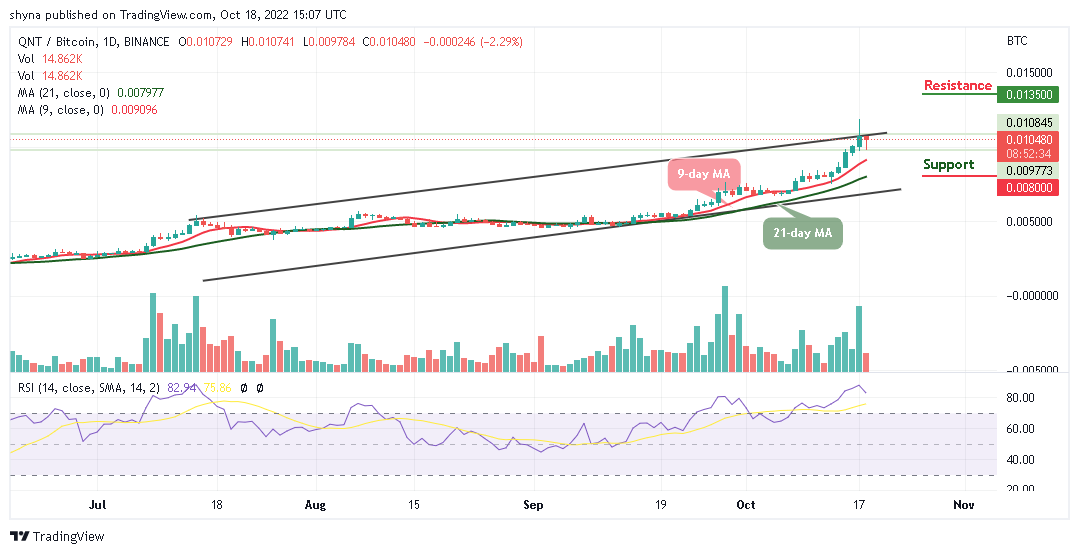
However, as the technical indicator Relative Strength Index (14) nose-dives to the south, if the buyers failed to hold the support of 9784 SAT, the market price may focus on the downtrend, and 9-day and 21-day moving averages may take it to the nearest support at 8000 SAT and below, but a rebound could push the price above the upper boundary of the channel, which could locate the potential resistance at 1350 SAT and above.
Related:
Join Our Telegram channel to stay up to date on breaking news coverage