Join Our Telegram channel to stay up to date on breaking news coverage
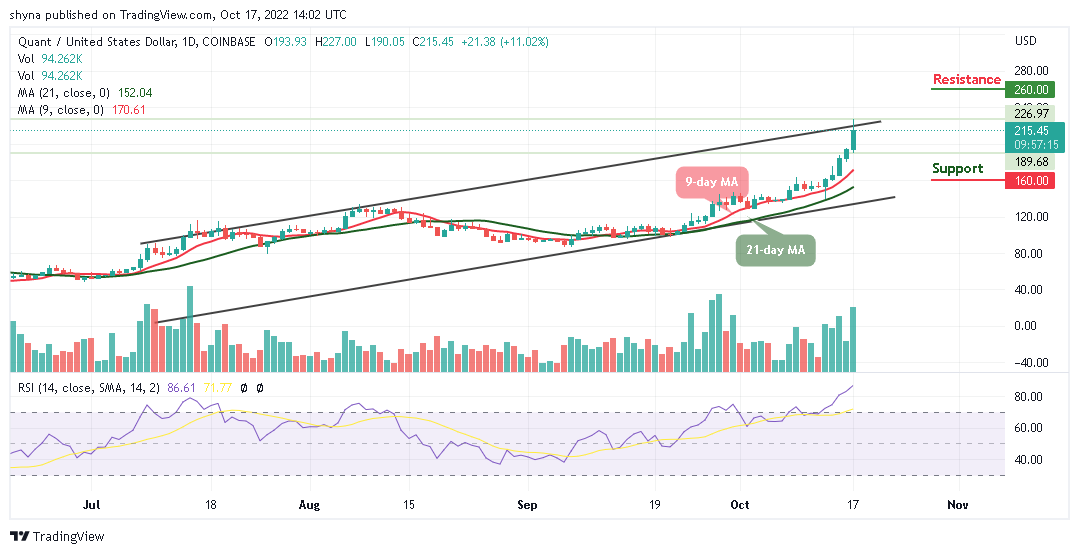
According to the daily chart, after touching the daily low of $190, the Quant price prediction touches a new daily high of $227.
Quant Prediction Statistics Data:
- Quant price now – $215.45
- Quant market cap – $2.5 billion
- Quant circulating supply – 12 million
- Quant total supply – 14.6 million
- Quant Coinmarketcap ranking – #28
QNT/USD Market
Key Levels:
Resistance levels: $260, $280, $300
Support levels: $160, $140, $120
Your capital is at risk
QNT/USD is trading at $215.45 after confirming a daily uptrend and climbing toward the upper boundary of the channel. However, the Quant is making a triumphant return above the 9-day and 21-day moving averages; therefore, the Quant price could touch a new daily high at over $227.00 in the next positive direction.
Quant Price Prediction: Quant (QNT) Ready to Spike High
As the daily chart reveals, the 9-day moving average is confidently above the 21-day moving average. The Quant price is likewise trading at the resistance level of $230, which connotes that buyers are gaining upper hand in the market. However, the technical indicator Relative Strength Index (14) is currently moving within the overbought region, giving more buy signals.
Meanwhile, if buyers should be able to push the price above the upper boundary of the channel and the daily candlestick closes above it, QNT/USD may rally towards the resistance levels of $260, $280, and $300, while the supports could be located at $160, $140, and $120 respectively.
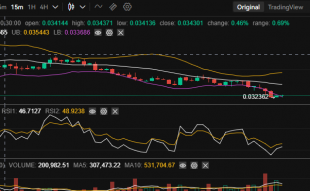
Against Bitcoin, the Quant price is moving tremendously towards the upside. However, if the Quant price continues with the bullish movement above the 9-day and 21-day moving averages, its price may swing high above the upper boundary of the channel to touch the resistance level of 1400 SAT and above.
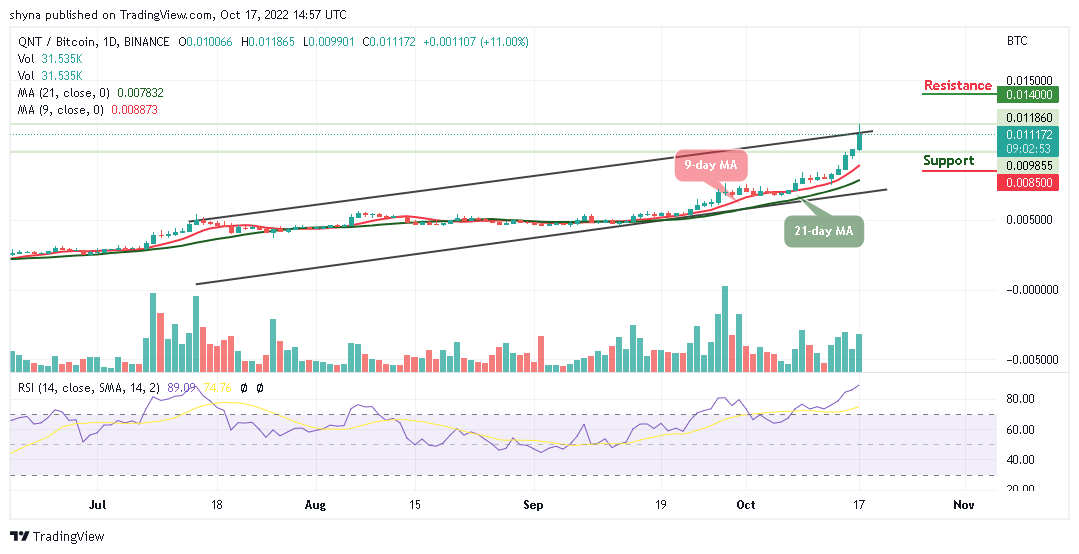
Meanwhile, on the contrary, sliding below the 9-day and 21-day moving averages could lead the coin to the support level of 8500 SAT and below. On the technical indicator, the Relative Strength Index (14) signal line is currently moving within the overbought region to confirm the bullish movement.
Join Our Telegram channel to stay up to date on breaking news coverage