Join Our Telegram channel to stay up to date on breaking news coverage
The Quant price prediction shows that QNT is rising with a gain of 2.55% over the past 24 hours as it crosses above the channel.
QNT Prediction Statistics Data:
- QNT price now – $164.85
- QNT market cap – $1.9 billion
- QNT circulating supply – 12 million
- QNT total supply – 14.6 million
- QNT Coinmarketcap ranking – #31
QNT/USD Market
Key Levels:
Resistance levels: $200, $210, $220
Support levels: $140, $130, $120
Your capital is at risk
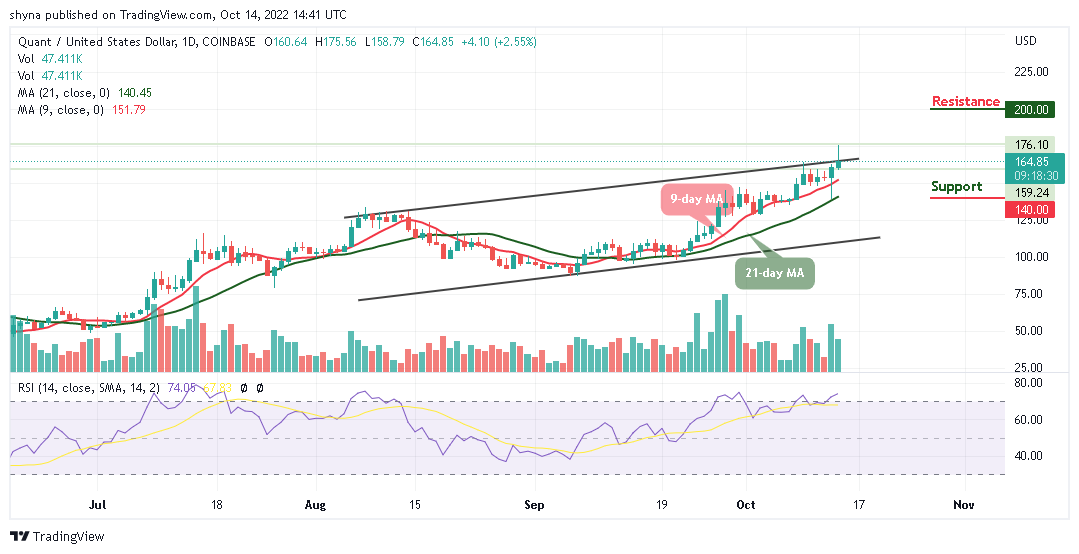
QNT/USD is trading above the resistance level of $160 as the coin heads to the upside. It could be possible that as soon as the coin crosses above the upper boundary of the channel, more it is likely to break higher. However, if the Quant price slides below the 9-day and 21-day moving averages, traders could expect the market price to break beneath, and this may likely hit the critical support levels of $140, $130, and $120.
Quant Price Prediction: QNT May Follow the Upward Movement
According to the daily chart, the Quant price is hovering around $164.85 with a strong bullish movement above the moving averages. However, should in case the bulls put more pressure, the QNT price may cross above the upper boundary of the channel to hit the resistance levels of $200, $210, and $220.
However, the technical indicator Relative Strength Index (14) is on the upside as the signal line moves within the overbought region. More so, the bulls may come into focus if a larger divergence to the upside is noticed within the market.
Against Bitcoin, the QNT price is also trading bullishly above the 9-day and 21-day moving averages. However, QNT/BTC is now moving around the upper boundary of the channel as the buyers dominate the market. From above, if the bulls can push the coin above the upper boundary of the channel, traders may expect initial resistance at 9000 SAT.
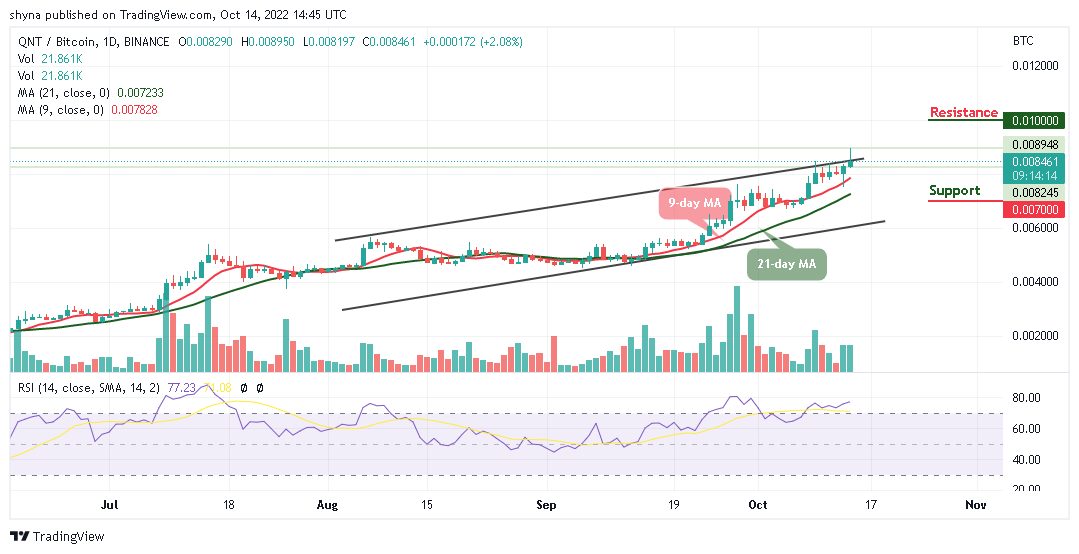
Therefore, any further bullish movement may hit a higher resistance level at 10000 SAT and above. Alternatively, If the sellers bring the market below the moving averages, QNT/BTC may hit critical support at 7000 SAT and below. Meanwhile, the Relative Strength Index (14) remains within the overbought region to continue the bullish movement.
Join Our Telegram channel to stay up to date on breaking news coverage