
Join Our Telegram channel to stay up to date on breaking news coverage
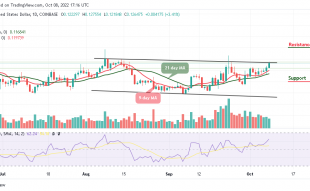
The Quant price prediction shows that QNT is moving above the main resistance level of $145 as the coin aims higher.
Quant Prediction Statistics Data:
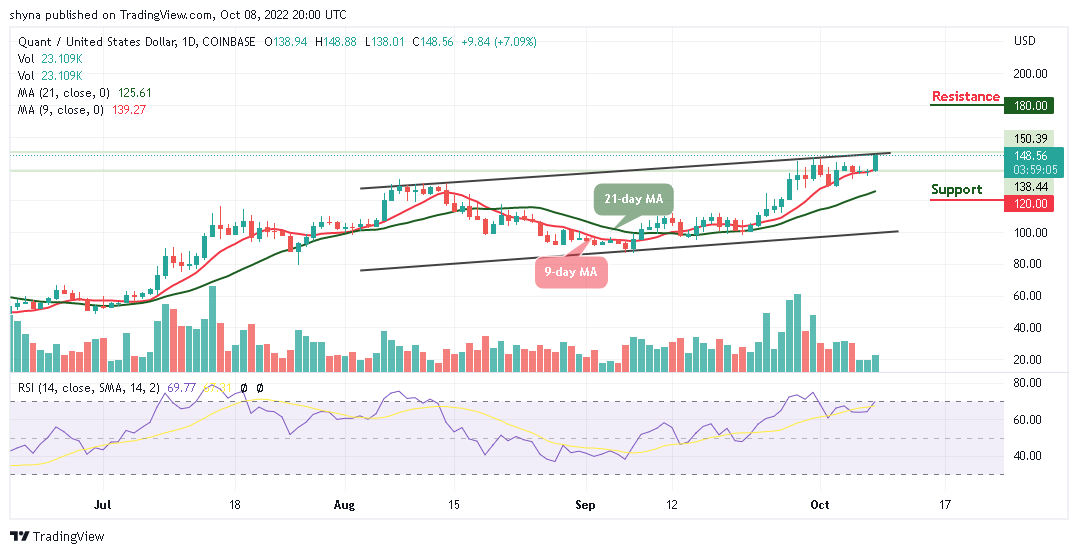
- Quant price now – $148.56
- Quant market cap – $1.79 billion
- Quant circulating supply – 12 million
- Quant total supply – 14.6 million
- Quant Coinmarketcap ranking – #32
QNT/USD Market
Key Levels:
Resistance levels: $180, $190, $200
Support levels: $120, $110, $100
Your capital is at risk
QNT/USD is seen following the bullish movement as the coin continues to break many mountains. Presently, the Quant (QNT) is making a gain of almost 7.09% and touches the daily high at $148. However, the Quant price is seen hovering above the 9-day and 21-day moving averages and traders may expect the Quant price to prepare itself steadily for a ride toward the nearest resistance level of $150.
Quant Price Prediction: QNT Price Ready to Blow Hot
The Quant price has been moving from the opening price of $138.94 to touching the daily high of $148.88 and at the same time moving to break the upper boundary of the channel. Meanwhile, the ongoing trend may move a little bit higher in the next positive move if the 9-day MA stays above the 21-day MA. However, any further bullish movement within the market could hit additional resistance levels at $180, $190, and $200 respectively.
Moreover, any bearish drop below the 9-day and 21-day moving averages may cause the market to follow a downward movement and could also to the initial support level of $148.56. Meanwhile, the support levels are located at $120, $110, and $100. As the daily chart reveals, the technical indicator Relative Strength Index (14) is moving into the overbought region which indicates that more bullish signals may come to play.
When compares with Bitcoin, the Quant is currently trading above the 9-day and 21-day moving averages. The price is changing hands at 0552 SAT as the technical indicator Relative Strength Index (14) moves out of the overbought zone.
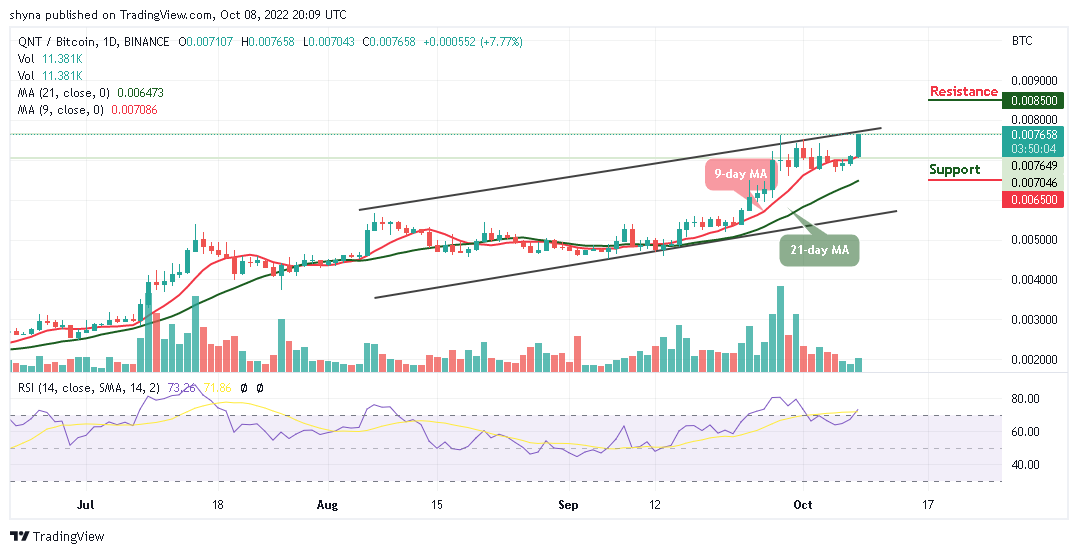
However, on the contrary, any bearish movement to the south could hit critical support at 6500 SAT and below. Inversely, a higher sustainable move above the upper boundary of the channel may likely attract new buyers to the market with the next resistance at 8500 SAT and above.
Join Our Telegram channel to stay up to date on breaking news coverage