Join Our Telegram channel to stay up to date on breaking news coverage
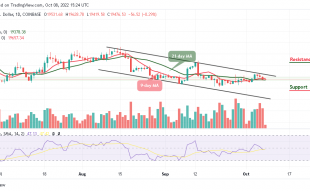
The Stellar price prediction shows that XLM is attempting to cross above the upper boundary of the channel.
Stellar Prediction Statistics Data:
- Stellar price now – $0.126
- Stellar market cap – $3.1 million
- Stellar circulating supply – 25.54 billion
- Stellar total supply – 50 billion
- Stellar Coinmarketcap ranking – #25
XLM/USD Market
Key Levels:
Resistance levels: 0.140, $0.142, $0.144
Support levels: $0.110, $0.108, $0.106
Your capital is at risk
XLM/USD peaks at $0.127 today, after which the coin begins to consolidate within the channel. However, the Stellar will have to stay above the 9-day and 21-day moving averages in other to guide against the downward pressure while the closest support expects the coin at $0.120, which could be a daily low.
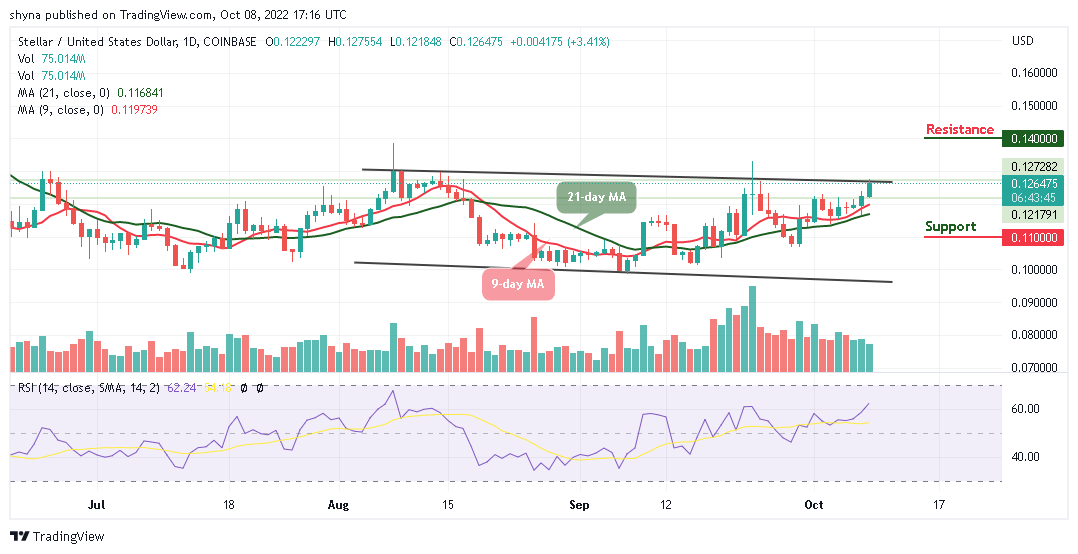
Stellar Price Prediction: Stellar Likely to Hit $0.130 High
At the time of writing, the Stellar price is likely to trend to the upside. However, the movement above the upper boundary of the channel could push the coin to the resistance levels of $0.140, $0.142, and $0.144. On the downside, a bearish movement below the 9-day and 21-day moving averages could stop the initial upward movement and create bearish momentum with the focus to bring the market to the next support levels at $0.110, $0.108, and $0.106 respectively.
At the moment, the technical indicator Relative Strength Index (14) crosses above the 60-level, which indicates that the market may continue with the uptrend. Looking at the daily chart, the 9-day moving average remains above the 21-day moving average which could allow the buyers to concentrate on stirring action to the north.
Compares to Bitcoin, the Stellar is hovering above the 9-day and 21-day moving averages. Meanwhile, following the recent positive sign, the XLM price may slightly go down if the sellers resume back into the market.
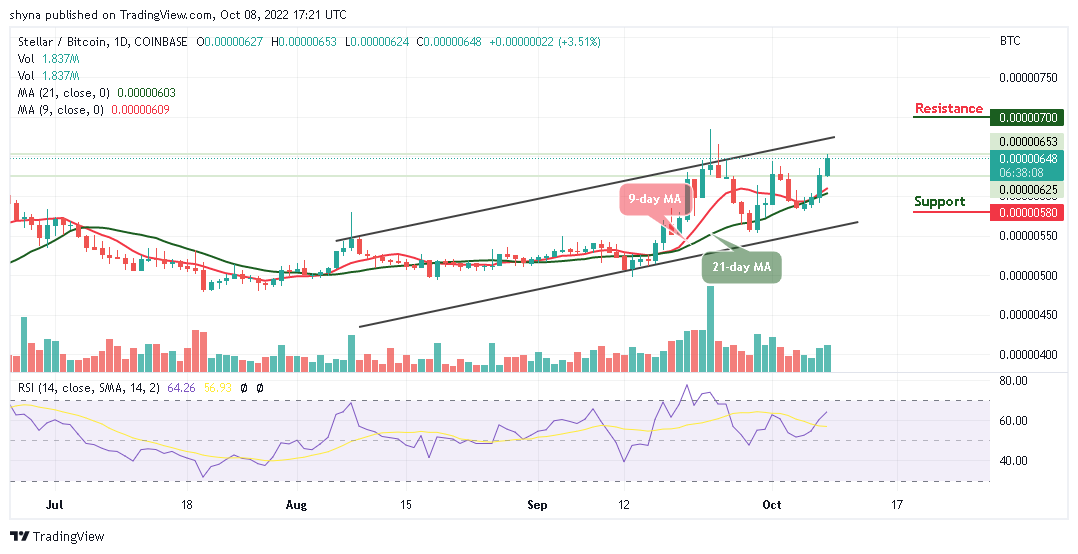
Therefore, if the bears succeeded in breaking below the moving averages, the market price could reach the support level at 580 SAT and below. However, any further bullish movement could allow the coin to go above the upper boundary of the channel to hit the resistance level of 700 SAT and above as the technical indicator Relative Strength Index (14) crosses above the 60-level to boost the bullish movement.
Join Our Telegram channel to stay up to date on breaking news coverage