Join Our Telegram channel to stay up to date on breaking news coverage
The Quant price prediction manages to maintain its position, while the bulls maintain the desire to defend the support at $132.
Quant (QNT) Prediction Statistics Data:
- QNT price now – $136.2
- QNT market cap – $1.6 billion
- QNT circulating supply – 12 million
- QNT total supply – 14.6 million
- QNT Coinmarketcap ranking – #37
QNT/USD Market
Key Levels:
Resistance levels: $175, $185, $195
Support levels: $100, $90, $80

Your capital is at risk
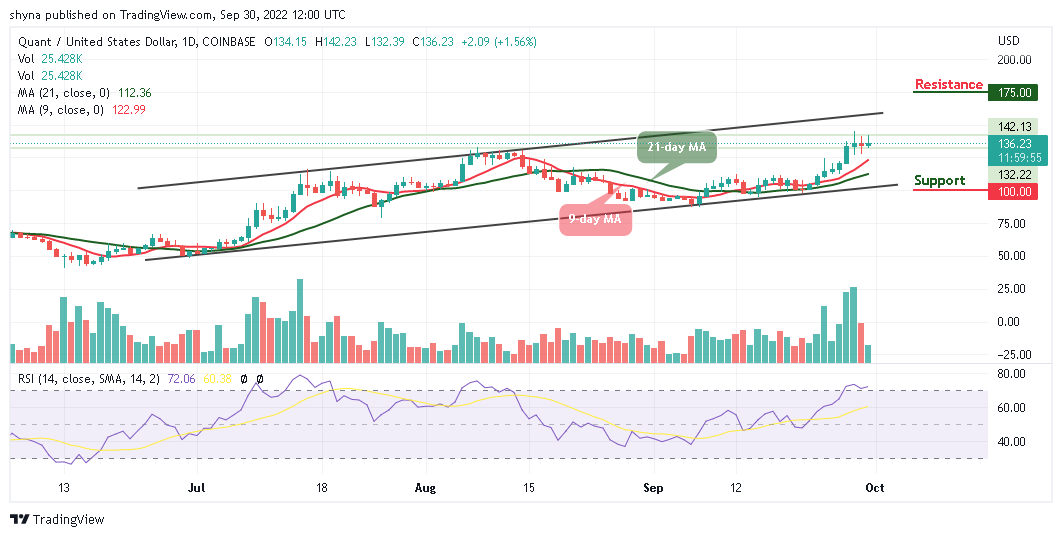
QNT/USD is at the time of writing undergoing a much-needed break to the positive side. Looking at the daily chart, the Quant price is posting gains of over 1.56% after touching the daily high at $142.23, trading above the 9-day and 21-day moving averages.
Quant Price Prediction: Where is QNT Price Going Next?
The Quant price continues to follow the bullish movement as the buyers keep the coin above the 9-day and 21-day moving averages. The market price is now roaming around the $136.23 level. Meanwhile, if the market continues the upward movement, the $145 resistance level is likely to surface in the next few positive moves.
On the other hand, if QNT/USD heads to the south, the market price may touch the supports at $100, $90, and $80. However, the Relative Strength Index (14) shows that the signal line is within the overbought region, the next resistance levels could be located at $175, $185, and $195 respectively.
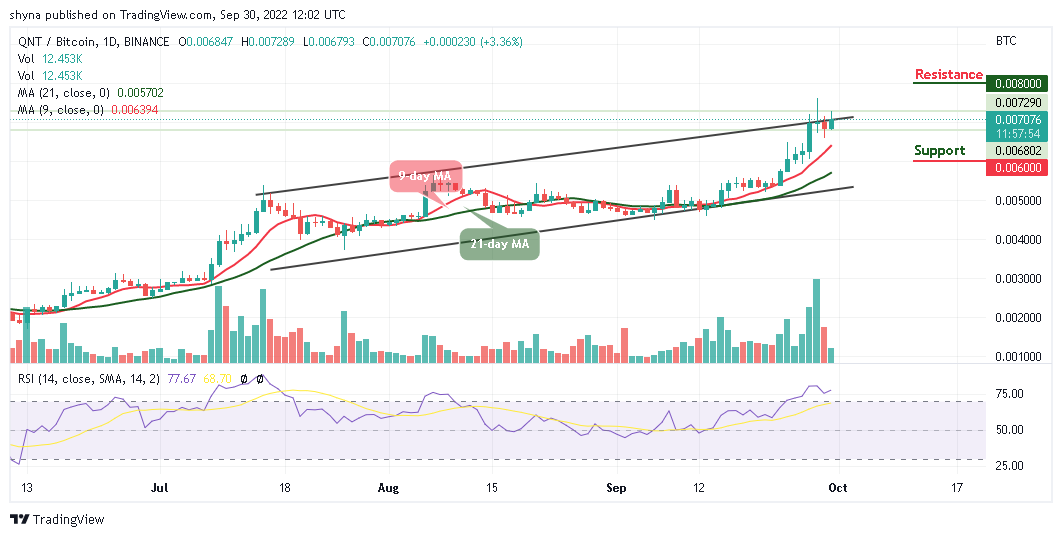
Against Bitcoin, the Quant price is moving tremendously above the 9-day and 21-day moving averages, aiming to cross above the upper boundary of the channel. However, any further bullish movement above the upper boundary of the channel could hit the potential resistance level at 8000 SAT and above.

On contrary, should the sellers resume back into the market, any bearish movement could locate the support level at 6000 SAT and below. Meanwhile, the technical indicator Relative Strength Index (14) is moving within the overbought region to increase the bullish movement.
Join Our Telegram channel to stay up to date on breaking news coverage


