
Join Our Telegram channel to stay up to date on breaking news coverage
Bears may oppose bulls in Polygon market
Polygon (MATICUSD) Price Analysis – October 18
In case buyers exert more pressure, Polygon will break up the resistance level of $0.67, this may also increase the price to $0.93 and $1.01 resistance levels. When the bears exert more pressure, Polygon price may decrease to the support level of $0.76, $0.70 and the support level of $0.64.
Key Levels:
Resistance levels: $0.87, $0.93, $1.01
Support levels: $0.76, $0.70, $0.64
MATIC/USD Long-term Trend: Bullish
On the Long-term outlook, MATIC/USD price is bullish. The bullish trend commenced when the price located support at $0.70 level, the just mentioned level was the previous low. The bears’ momentum could no longer break down the support level of $0.70. A bullish engulfing candle emerged and this triggered a bullish movement in the MATIC market. The resistance level of $0.76 was penetrated and it is testing $0.87 level.
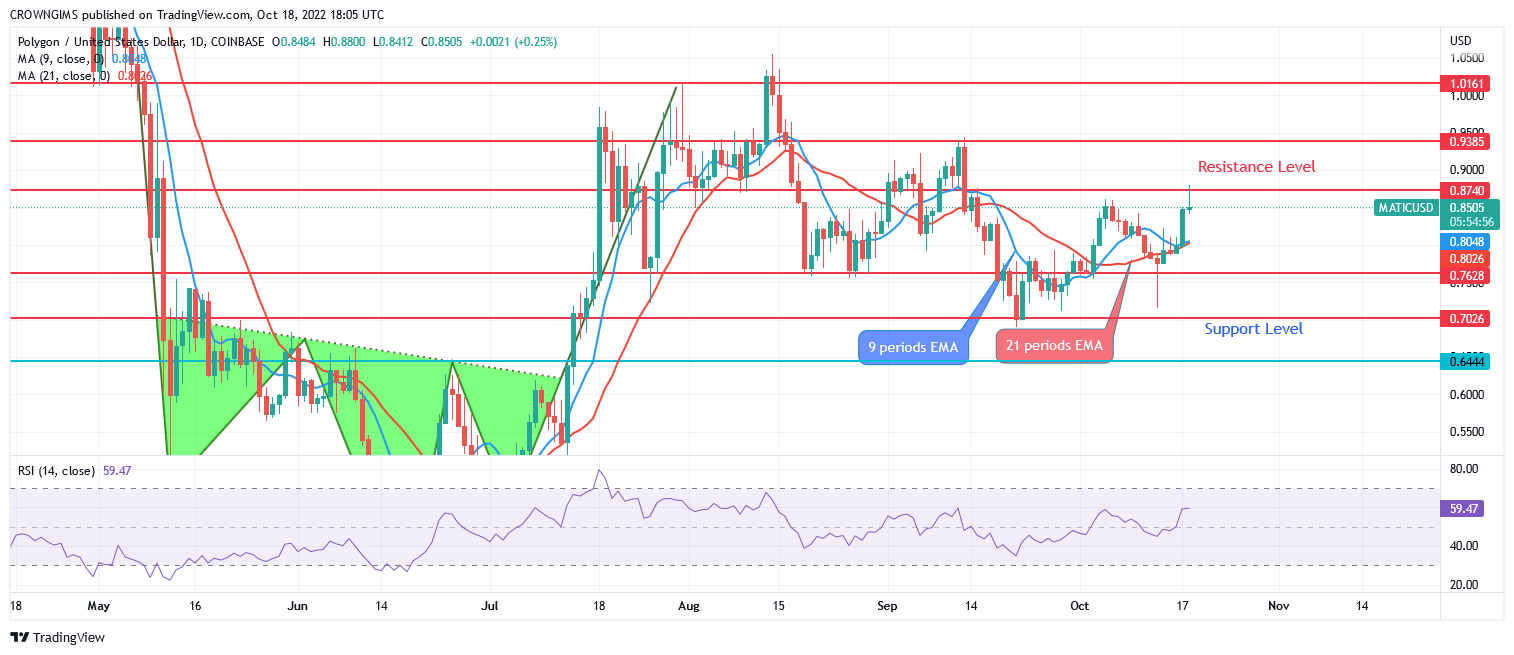
Fast moving average is crossing the slow moving average and Polygon is trading above the 9 periods EMA and 21 periods EMA. In case buyers exert more pressure, Polygon will break up the resistance level of $0.67, this may also increase the price to $0.93 and $1.01 resistance levels. When the bears exert more pressure, MATIC price may decrease to the support level of $0.76, $0.70 and the support level of $0.64.
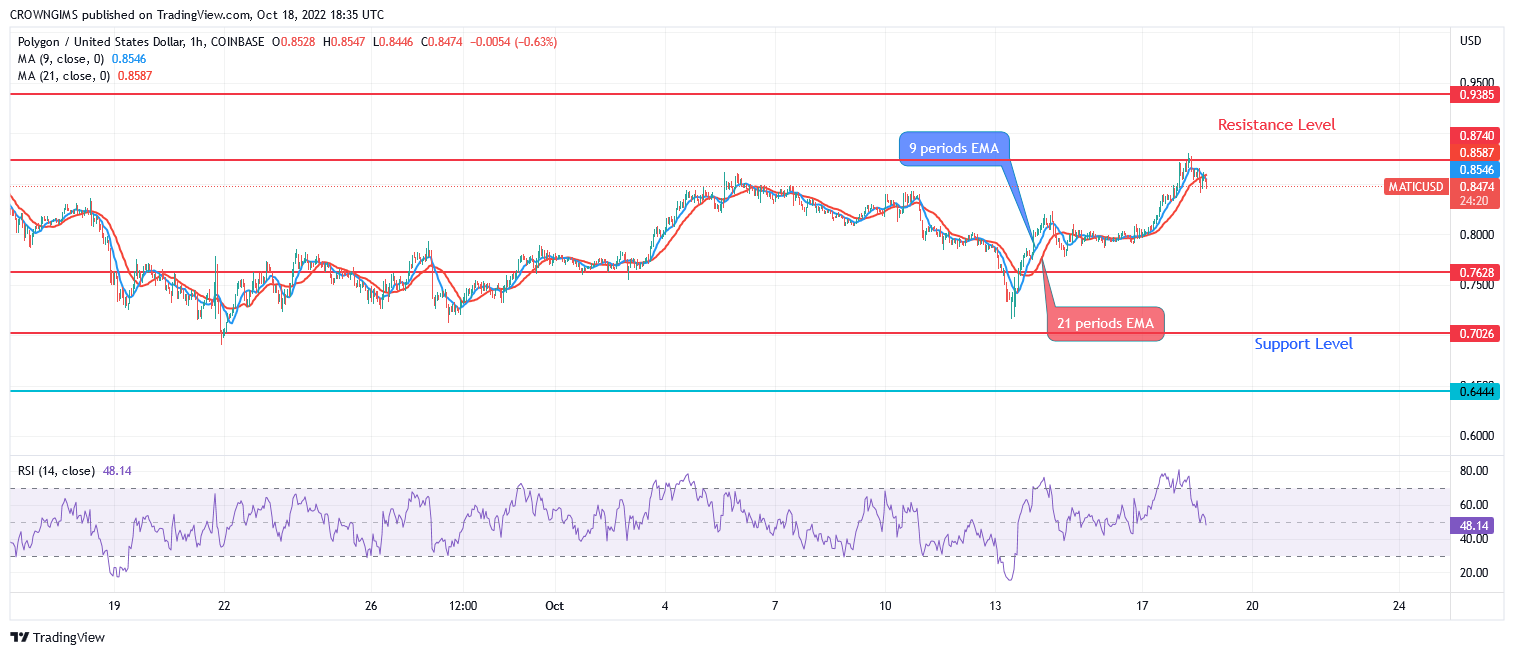
MATIC/USD Short-term Trend: Bullish
Polygon is bullish on the medium-term outlook. When Sellers pushed the price to the support level of $0.70. Sellers’ momentum failed, then, Bulls gained more pressure, and bullish candles were produce and the price increase accordingly. At the moment, the resistance level of $0.87 is being tested.
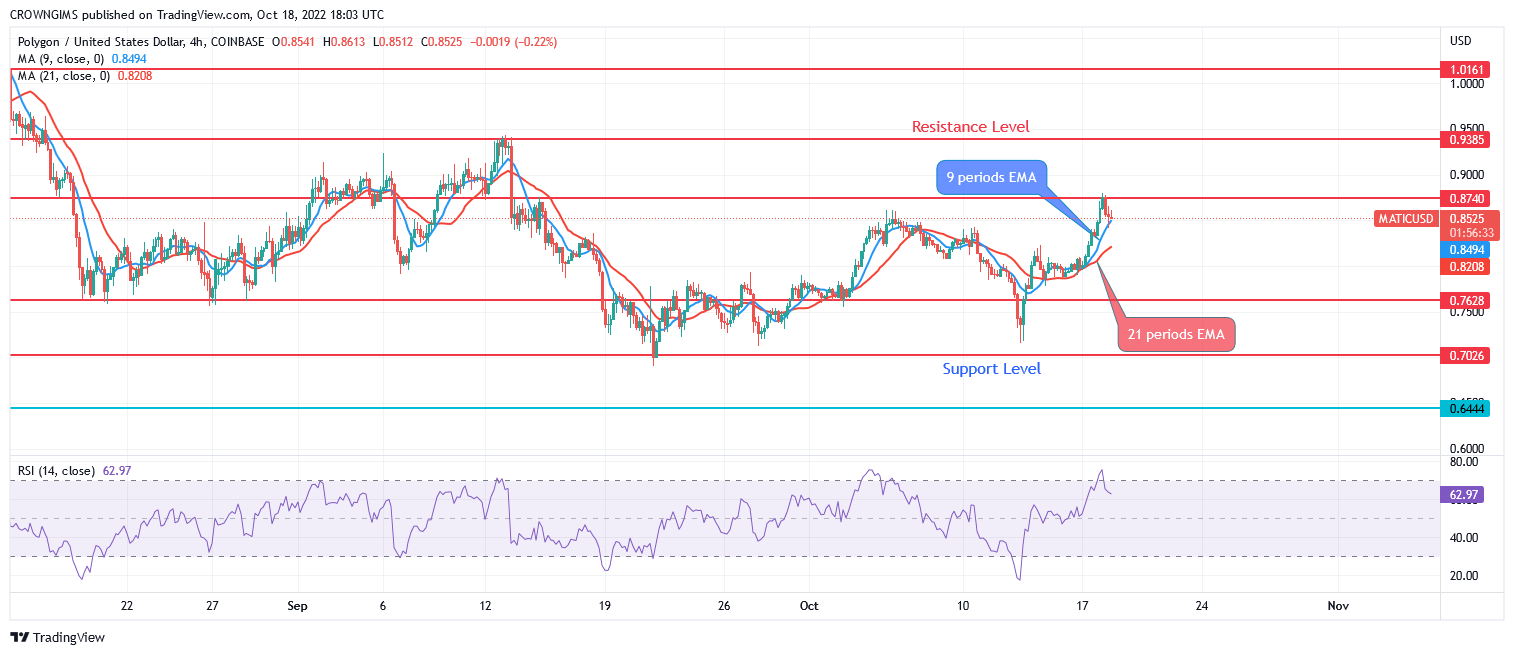
The Polygon price is trading above the two EMAs with close distance between them which indicates a bullish trend. The 9-day EMA is above the 21 periods EMA. The relative strength index period 14 is at 63 levels with the signal line pointing down which indicate sell signal, which may be a pullback.
One alternative to Bitcoin is IMPT token, which is on presale now at the link below and has raised $4.5 million so far.
-
Related
- How to Buy IMPT Token
Join Our Telegram channel to stay up to date on breaking news coverage