Join Our Telegram channel to stay up to date on breaking news coverage
Polkadot Price Prediction – June 20
The DOT/USD market operation yet features under the sell signal sides of the trading tools as the crypto tends to lose momentum around the $9 level. There has been little difference between the high and the low trading points as price features around the $8 and the $7, keeping 2.93% positives.
Polkadot (DOT) Statistics:
DOT price now – $7.89
DOT market cap – $7.8 billion
DOT circulating supply – 987.6 million
DOT total supply – 1.1 billion
Coinmarketcap ranking – #11
DOT/USD Market
Key Levels:
Resistance levels: $9, $12, $15
Support levels: $6, $4, $2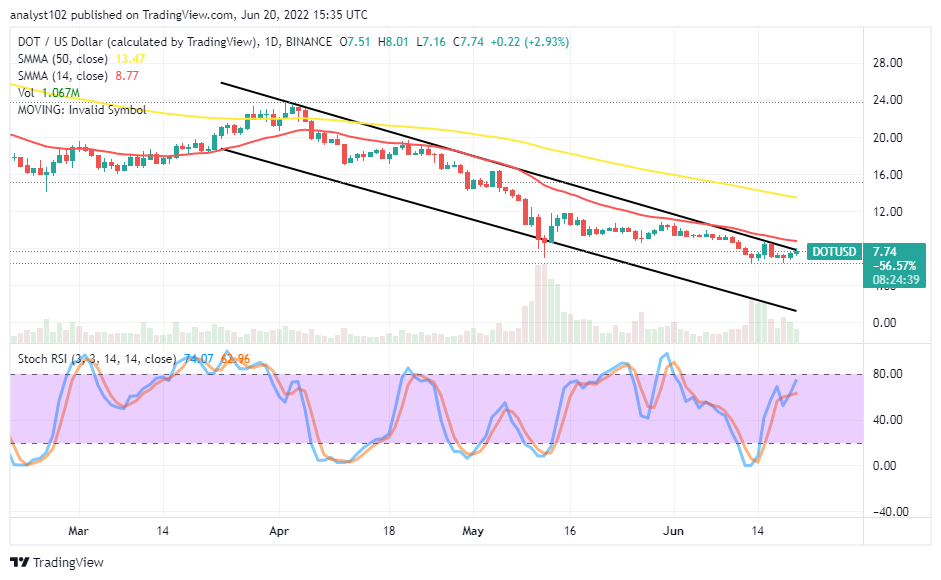 GMT/USD – Daily Chart
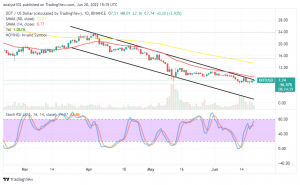
The DOT/USD daily chart showcases the crypto-economic price tends to lose around the $9 resistance level in the near session. The northward pushing force capacity outlook of the market appears the fast approaching area of exhaustion. The upper bearish trend line drew around the smaller SMA trend line. The 50-day SMA indicator is over the 14-day SMA indicator. The Stochastic Oscillators have sprung northbound from the oversold region close to the range point at 80 to denote a buying force is featuring in a lighter mode.
Will the DOT/USD market downsize soon from the smaller-SMA resistance point at 8.77?
As it has been that a lighter-northward pushing force is ongoing, the DOT/USD market tends to lose the momentum around the $9 resistance level, which is not much different from the area of the resistant-trading value indicated by the 14-day SMA indicator. Despite the buying force signal present in the market, the situation doesn’t portend a reliable avenue for pushes to the upside. But, investors should hold on to their portfolios.
On the downside of the technical analysis, the DOT.USD market bears have a high probability of pushing the market southward between those identified resistance levels. The price consolidation movements around the smaller SMA trend line may not produce a long-term rallying motion that will reach for a higher resistance point indicated by the bigger SMA at the $13.47 value line afterward. Traders needed to back up their execution of orders with price actions.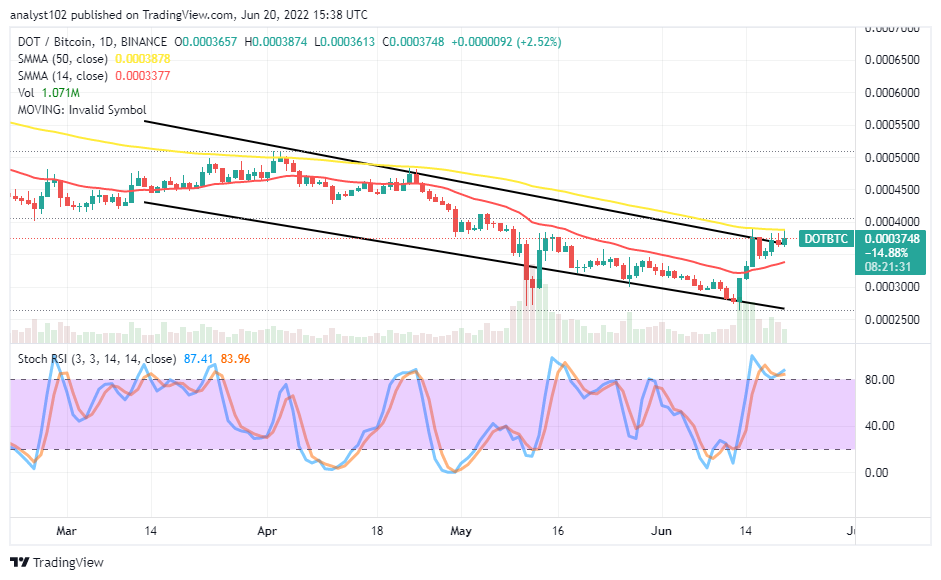
DOT/BTC Price Analysis
In comparison, Polkadot has pushed northward against the trending capacity of Bitcoin to touch a higher trading resistance zone around the bigger-SMA trend line. The cryptocurrency pair market tends to lose momentum around the 50-day SMA trading indicator as the 14-day SMA indicator is underneath it. And it has briefly bent northward within the bearish channel trend lines. The Stochastic Oscillators are in the overbought region, swinging within it to denote that a consolidation motion is ongoing. The fewer candlesticks featured show variant rejection signs suggesting the base crypto tends to lose back to its counter crypto.
Looking to buy or trade Polkadot (DOT) now? In-Content Heroes link!
68% of retail investor accounts lose money when trading CFDs with this provider.
Read more:
Join Our Telegram channel to stay up to date on breaking news coverage