
Join Our Telegram channel to stay up to date on breaking news coverage
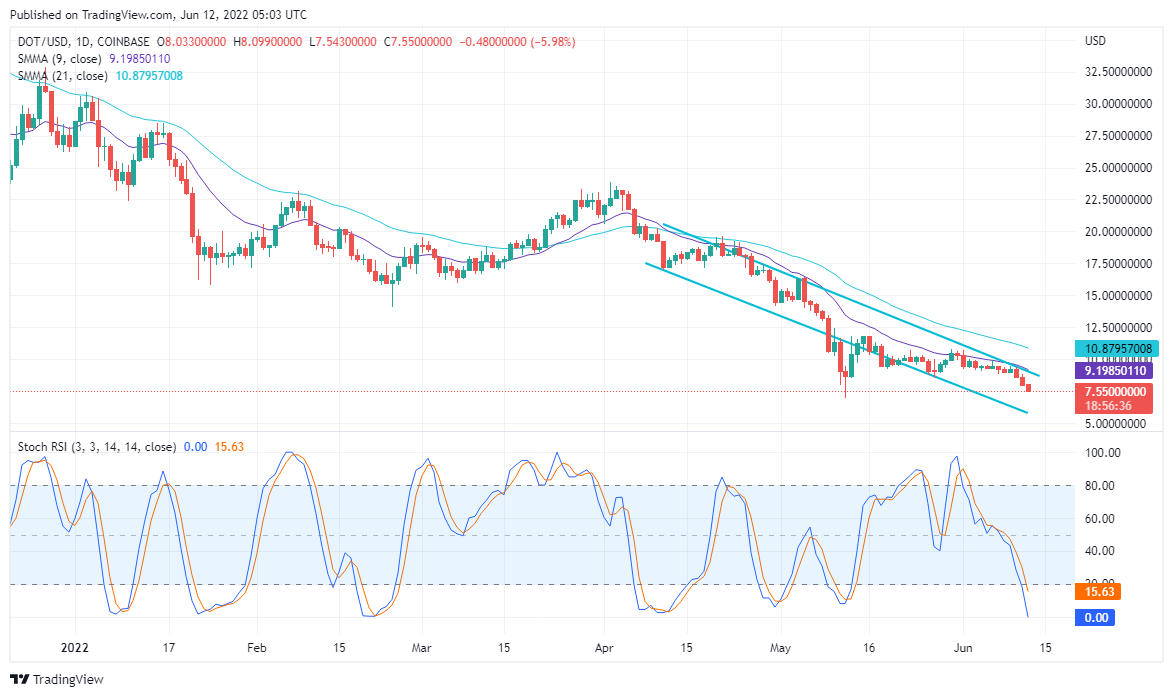
Initially, the DOT/USD price is sliding downwards in a narrow Price channel of about $5.85 – $9.43. This move started in May and has generally continued till now.
DOT Price Data:
DOT Current Price: $7.75
DOT Market Cap: 7.6 Billion
Total Supply: —
Rank: 11
Key Levels:
Resistance: $8.91, $9.34, $9.44
Support: $8.57, $8.29, $6.29
Firstly, Looking at the DOT/USD price action from a horizontal point; from around 12 of May, the market seems to be ranging. However, we will look at this price action as sliding downwards, in a price channel as earlier stated.
Polkadot Price Prediction: Can There Be an Uptrend in DOT Market?
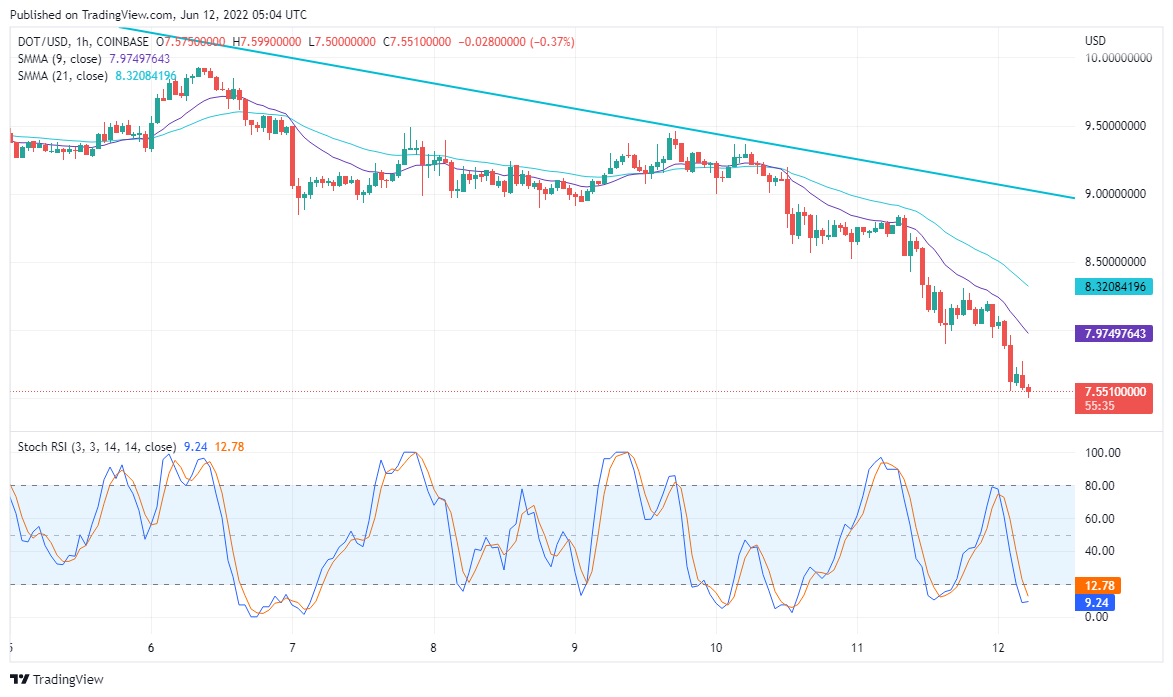
Secondly, 0n the 1-hour chart, the Price action has crossed the moving averages to the downside. In addition, considering the last candle on the chart, we can observe a fierce struggle between buyers and sellers. Going by this candle, the buyers eventually won the fight. However, the outcome of this struggle gave the DOT its price of $7.55. Furthermore, the Stochastic RSI indicator showed that the DOT/USD is already in the oversold region. Also, the faster line: The blue line, appears to be flatting out. If the RSI lines eventually cross each other here, the uptrend might be on the rise.
Polkadot Price Prediction: DOT Downtrend May Continue
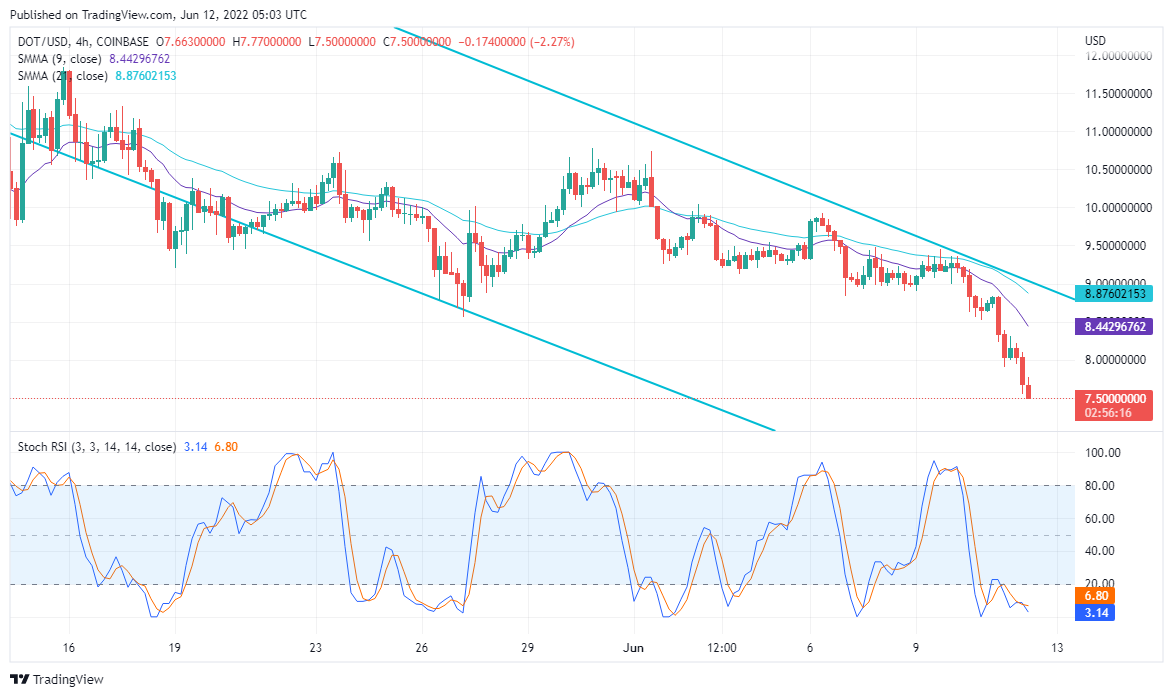
Thirdly, coming from the 1-hour chart, it appears that the effort of buyers to pull the price up failed. Consequently, the buyer’s failure is reflected on the 4-hour chart, as Price action falls further: bringing the Crypto price to $0.750. Also, the lines of the RSI Indicator touch each other, however, it diverges as soon as it does and continues to move downwards. In addition, the bears appear to be in control of the DOT/USD price as it remains oversold.
Conclusion
Finally, the bearish trend will come to an end and it will be the turn of the bulls. It will be profitable to buy now, as the DOT price may later climb higher to levels of $9.10, $10.00, and perhaps $11.00.
Join Our Telegram channel to stay up to date on breaking news coverage