Join Our Telegram channel to stay up to date on breaking news coverage
The Polkadot price prediction may find a halt at $6 as the price has been hovering below $7 over the last 24 hours.
Polkadot Prediction Statistics Data:
- Polkadot price now – $6.79
- Polkadot market cap – $6.6 billion
- Polkadot circulating supply – 987.5 million
- Polkadot total supply – 1.1 billion
- Polkadot Coinmarketcap ranking – #12
DOT/USD Market
Key Levels:
Resistance levels: $11, $12, $13
Support levels: $4.5, $3.5, $2.5
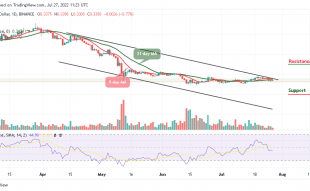
DOT/USD may begin to drop lower if the coin finds support at the $6 level. However, during the European session, DOT/USD tried to cross above the 9-day and 21-day moving averages before falling back below the $6.79 level. At the moment, if the bears continue to push the market further lower, immediate support below the $5.5 level may be located. Beneath this, further supports may be found at $4.5, $3.5, and $2.5 respectively.
Polkadot Price Analysis: DOT Price May Head to the Downside
As the daily chart reveals, if the buyers can hold the support at $6 and the Polkadot price begins to climb higher, bulls may expect immediate resistance to be located at $8, which is above the 9-day and 21-day moving averages. However, moving a little bit higher may locate the higher resistance levels at $11, $12, and $13. Meanwhile, the technical indicator Relative Strength Index (14) is seen ranging below the 50-level, which shows that the market may follow the sideways movement.
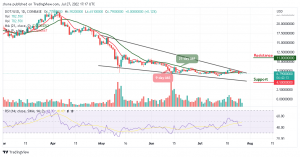
DOT/BTC Market: Price Keeps Following the Downtrend
Against Bitcoin, the Polkadot is trading below the 9-day and 21-day moving averages. Therefore, in as much as the price actions remain below this barrier, Polkadot may perpetually be under the control of a bear. Meanwhile, traders need more strong and more consistent resistance to keep the price from the bear run.
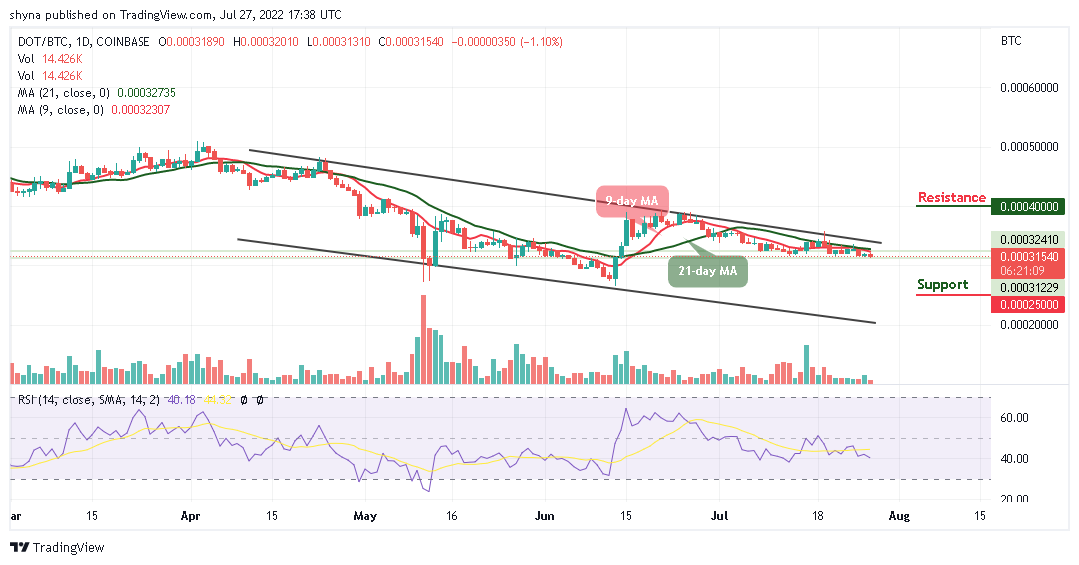
However, with the current movement in the daily chart, if the price crosses above the 9-day and 21-day moving averages, it may likely reach the potential resistance level at 4000 SAT and above. On the contrary, if the market price heads toward the lower boundary of the channel, it may likely hit the critical support at 2500 SAT and below as the technical indicator Relative Strength Index (14) moves to cross below the 40-level.
Read more:
Join Our Telegram channel to stay up to date on breaking news coverage