Join Our Telegram channel to stay up to date on breaking news coverage
The Polkadot price prediction shows that DOT faces the south and it may likely touch the nearest support level of $7.
Polkadot Prediction Statistics Data:
- Polkadot price now – $7.27
- Polkadot market cap – $7.1 billion
- Polkadot circulating supply – 987.5 million
- Polkadot total supply – 1.1 billion
- Polkadot Coinmarketcap ranking – #12
DOT/USD Market
Key Levels:
Resistance levels: $12, $13, $14
Support levels: $4, $3, $2
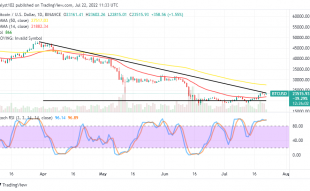
DOT/USD keeps ranging as the coin heads to the downside. At the time of writing, the Polkadot price is likely to slide below the 9-day and 21-day moving averages if the bears increase the pressure. However, the technical indicator Relative Strength Index (14) is also moving to cross below 50-level as the signal line heads to the south.
Polkadot Price Prediction: Polkadot Could Gain More Downsides
As seen on the daily chart, the Polkadot price may continue to face the downtrend as soon as the coin crosses below the 9-day and 21-day moving averages. The best the bulls can do is to defend the support at $7 and begin to push the price towards the upper boundary of the channel. However, DOT/USD is likely to make an effort to push the price back to the upside, and it is also looking forward to reclaiming the ground past $8 in the next positive direction.
Nevertheless, with an increase in buying pressure, the Polkadot price may break above the channel to hit the $8 resistance. While trading at this level, a bullish continuation could reach the resistance levels of $12, $13, and $14 respectively. However, if the coin begins to follow the negative side, a bearish movement could bring the price to the support levels of $4, $3, and $2.
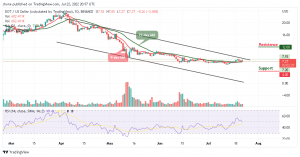
Against Bitcoin, the Polkadot price stays below the 9-day and 21-day moving averages as the price heads to the negative side. According to the chart, the trend may likely follow the downtrend if the buyers failed to push the price above the upper boundary of the channel.
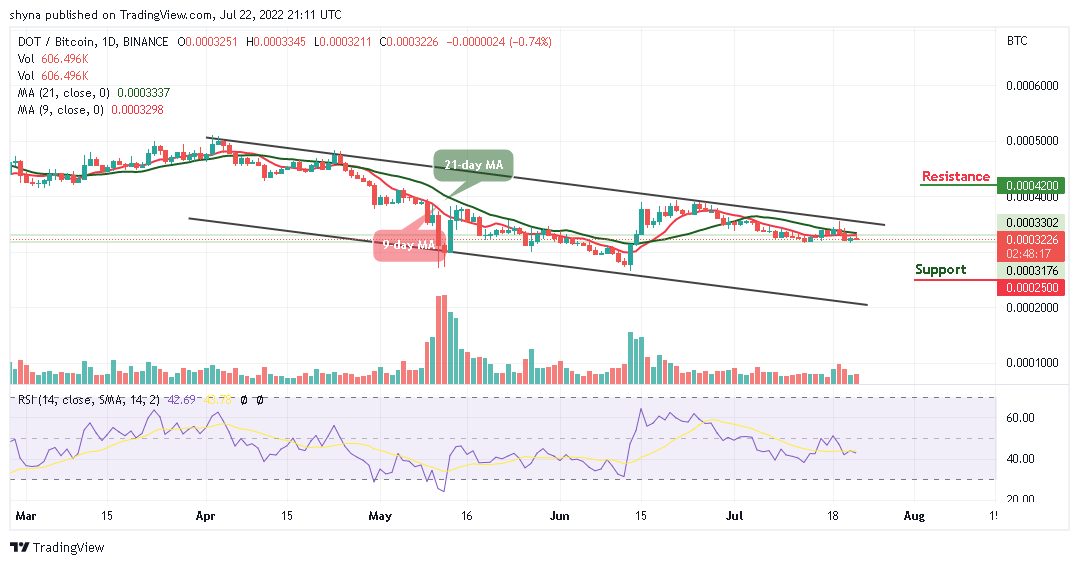
The technical indicator Relative Strength Index (14) moves above the 40-level, any bearish move below this barrier could lower the price to the support level of 2500 SAT and below. On the contrary, the market price may begin an upward trend which could push the coin to hit the resistance level of 4200 SAT and above.
Read more:
Join Our Telegram channel to stay up to date on breaking news coverage